My personal FX pairs and XAUUSD analysis

Status
Not open for further replies.
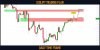
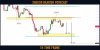
#GBPAUD: Important Breakout
GBPAUD was stuck for some time on 1.75 - 1.763 horizontal supply area.
That structure was finally broken this week.
It turned in a demand zone now.
I will expect a bullish wave from that at least to 1.788
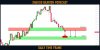
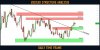
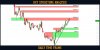
15 Best Forex Breakout Strategies
 

Attachments

  • gbpaud.jpg
    gbpaud.jpg
    53.5 KB · Views: 4
#EURGBP: Time to Fall

EURGBP has nicely respected a wide 4H horizontal supply area.
The price formed a triple top pattern on that and broke its neckline then.

I expect a bearish move to 0.8798 / 0.8789
 

Attachments

  • eurgbp.jpg
    eurgbp.jpg
    58 KB · Views: 4
Nasdaq-100 Index (#US100) Short Trade Explained
Nasdaq Index is approaching a key daily structure resistance.
The price has formed a descending triangle formation on that on 1H time frame.
Its neckline was broken, and an hourly candle closed below that, confirming a highly probable coming bearish movement.
Next support: 12000
 

Attachments

  • nasdaq.jpg
    nasdaq.jpg
    105.4 KB · Views: 6
#USDJPY: Waiting For a Breakout
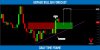
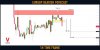
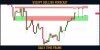
⚠️USDJPY is testing a solid horizontal daily resistance.
If the price breaks and closes above 134.5 - 135.5 area,
it will push the market much higher.
The next goal for buyers will be 137.6 level.
 

Attachments

  • usdjpy.jpg
    usdjpy.jpg
    97 KB · Views: 3
Nasdaq-100 Index (#US100) Short Trade Explained
Nasdaq Index is approaching a key daily structure resistance.
The price has formed a descending triangle formation on that on 1H time frame.
Its neckline was broken, and an hourly candle closed below that, confirming a highly probable coming bearish movement.
Next support: 12000
NDX broke below then bounced off 12,000 @ during first RTH hour.
 
Gold (#XAUUSD): The Breakout!
So it turned out that Gold dropped again.
After the release of US fundamentals on Friday,
bears started to push.
The price managed to close below a key daily horizontal structure support cluster.
It turned into resistance now.
Probabilities are high, and the market will keep falling next week.
Next support - 1787
 

Attachments

  • gold.jpg
    gold.jpg
    61.5 KB · Views: 4
Dollar Index (#DXY): Key Levels to Watch
Here is my latest structure analysis for ⚠️Dollar Index.
Resistance 1: 105.3 - 105.8 area
Resistance 2: 106.8 - 107.2 area
Resistance 3: 107.80 - 108 area
Support 1: 103.6 - 103.95 area
Support 2: 102.25 - 103.2 area
Vertical Support 1: rising trend line
Consider these structures for pullback/breakout trading.
 

Attachments

  • dxy.jpg
    dxy.jpg
    67.8 KB · Views: 3
#USDJPY: Bulls May Push Higher
Update for my Friday's post on USDJPY.
The price managed to close above a solid resistance cluster.
It turned into a support now.
The bullish rally will most likely continue.
Next resistance - 137.8
Wait for an occasional retest of a broken structure for safer entries.
 

Attachments

  • usdjpy.jpg
    usdjpy.jpg
    100.3 KB · Views: 3
Gold (#XAUUSD): Time To Sell
Gold is retesting a recently broken structure.
The price has nicely respected a confluence point based on the underlined resistance and 618 retracement of the last bearish impulse.
As the extra confirmation, the price formed a double top pattern.
I expect a bearish move to 1808 / 1801
 

Attachments

  • gold.jpg
    gold.jpg
    96.3 KB · Views: 2
#USDCAD: Key Levels to Watch This Week
Here is my latest structure analysis for ⚠️USDCAD.
Resistance 1: 1.366 - 1.3707 area
Resistance 2: 1.3745 - 1.381 area
Support 1: 1.347 - 1.352 area
Support 2: 1.3225 - 1.329 area
Vertical Support 1: major falling trend line .
Consider these structures for pullback or breakout trading strategy.
 

Attachments

  • usdcad.jpg
    usdcad.jpg
    124.8 KB · Views: 2
Status
Not open for further replies.
Back
Top