You are using an out of date browser. It may not display this or other websites correctly.
You should upgrade or use an alternative browser.
You should upgrade or use an alternative browser.
My personal FX pairs and XAUUSD analysis
- Thread starter Dominic Walsh
- Start date
- Status
- Not open for further replies.
It takes many many decades (or never) to be a successful trader.
So be very very hardworking and learn how to trade.
Trading is more than just drawing lines here and there,
and coloring the charts here and there.
Most of those things you learn from the trading books wouldn't work.
You have to learn how to improve the win rate from around 1% to around 40%.
Anyway, happy trading and happy learning.
Last edited:
I am a highly regarded trader, author & coach with over 16 years of experience trading financial markets. Today I am recognized by many as forex trading strategies and indicators developer. I also work with automated trading with top-accuracy Forex Robots and Expert Advisors. After starting blogging in 2014, I became one of the world's most widely followed forex trading coaches, with a monthly readership of more than 40,000 traders.EURCAD was consolidating for 3 weeks in a wide horizontal trading range on a daily.
Its support was finally broken this week.
I believe that the pair may go lower now.
Next support - 1.428
In this thread, I will share my daily analysis of FX pairs and XAUUSD.
Expert Advisors I use:
Shouts Gold EA for XAUUSD M1
Kingle EA for FX pairs and XAUUSD
Euro Scalper For EURUSD M1
For other MT4 Robots and Trading Strategies, visit My Blog
Forex Trading Strategies
Forex MT4 Indicators
Myfxbook
My Patreon
Follow me on socials:
Quora
Youtube
Medium
Telegram
Best Regards,
Dominic Walsh
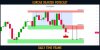
Here is my latest structure analysis for WTI Crude Oil.
Support 1: 72.3 - 73.2 area
Support 2: 70.0 - 71.4 area
Resistance 1: 81.7 - 85.2 wide supply area
Consider these structures for pullback/breakout trading.
If you wait for the support to be touched before taking a long position, you are going to miss many opportunities.
A few minutes ago during the European session, Crude oil just went up by a decent amount of > 2 points (> $2000/lot).
Last edited:
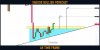
Gold (#XAUUSD): That Was a Breakout
So it turned out that Gold broke a major rising trend line yesterday.
The market has successfully closed below that on a daily, engulfing the last 3 bullish candles.
That violation may push the price lower.
Next support: 1833
So it turned out that Gold broke a major rising trend line yesterday.
The market has successfully closed below that on a daily, engulfing the last 3 bullish candles.
That violation may push the price lower.
Next support: 1833
Attachments
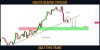
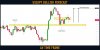
#AUDCAD: Bearish Outlook Explained
AUDCAD looks very bearish:
the price has broken 2 rising trend lines on a daily,
formed a double top and broke its neckline as well.
The price is retesting the confluence zone based on the broken structures.
Probabilities are high that the pair will drop soon.
Goals: 0.924 / 0.916
AUDCAD looks very bearish:
the price has broken 2 rising trend lines on a daily,
formed a double top and broke its neckline as well.
The price is retesting the confluence zone based on the broken structures.
Probabilities are high that the pair will drop soon.
Goals: 0.924 / 0.916
Attachments
- Status
- Not open for further replies.