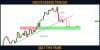
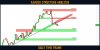
EURUSD is moving into a correction phase. The price rests against the conditional support at 1.065 and forms a bearish flag. This pattern shows us the potential to revive the fall further.
The price tests the support zone of 1.07116 in a bearish flag format. A breakdown of the support of the local range may lead to liquidating the buying liquidity and activating the momentum for a strong bearish impulse.
However, I expect in the near term an exit of the price from the range downwards, a breakdown of the support of 1.07116, and price movement towards 1.065, and then to 1.0430
Bear Flag Pattern
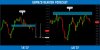
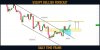
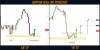
 NZDUSD.
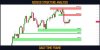
 Dollar Index (#DXY) daily time frame
  #GBPUSD daily time frame
 #USDCAD daily time frame
 #EURNZD daily time frame