My personal FX pairs and XAUUSD analysis

Status
Not open for further replies.
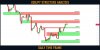
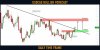
EURNZD: Classic Bullish Setup
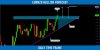
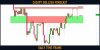
EURNZD broke and closed above a neckline of a huge ascending triangle formation on a daily.
Watch the underlined blue zone carefully. It is a contracting buy zone based on a trend line and a broken neckline.
I will expect a bullish wave from that.
Next resistance - 0.728
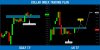
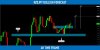
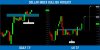
 

Attachments

  • eurnzd.jpg
    eurnzd.jpg
    100.6 KB · Views: 2
USDJPY: Key Levels to Watch This Week
Here is my fresh structure analysis for ⚠️USDJPY.
Resistance 1: 134.48 - 135.475 area
Resistance 2: 137.6 - 138.6 area
Support 1: 132.6 - 132.9 area
Support 2: 129.7 - 131.05 area
Support 3: 127.2 - 128.2 area
Consider these structures for pullback, breakout trading.
 

Attachments

  • usdjpy.jpg
    usdjpy.jpg
    63.2 KB · Views: 4
Dollar Index (#DXY): Your Detailed Trading Plan
We have spotted earlier a confirmed structure breakout on Dollar Index.
The market is retesting that at the moment.
To catch a bullish move from that with a confirmation, watch a double-bottom pattern on the 4H time frame.
104.05 - 104.09 is its neckline.
Wait for its bullish breakout; we need a 4H candle close above that to confirm the violation.
A bullish continuation will be expected then to 104.55.
If the price sets a new lower low, the setup will become invalid.
 

Attachments

  • dxy.jpg
    dxy.jpg
    100.7 KB · Views: 2
#CADJPY: Bullish Outlook Explained
CADJPY broke and closed above a solid horizontal supply zone on a daily.
The broken structure turned into a demand zone.
Probabilities are high that a bullish wave will initiate from that.
The goal for buyers - 101.0
 

Attachments

  • cadjpy.jpg
    cadjpy.jpg
    94.9 KB · Views: 2
#NZDJPY: Pullback From Key Level

NZDJPY is taking off from key support.
The price formed a double bottom on that and broke its neckline.

Goals: 84.35 / 84.8
 

Attachments

  • nzdjpy.jpg
    nzdjpy.jpg
    93.4 KB · Views: 2
#USDCAD: Important Breakout
USDCAD suddenly bounced yesterday.
The price formed a high momentum bullish candle, breaking a solid horizontal resistance and a primary falling trend line.
I believe that bulls may push the price much higher now.
Next goal - 1.366
 

Attachments

  • usdcad.jpg
    usdcad.jpg
    111.1 KB · Views: 2
DOLLAR INDEX (#DXY) Bullish Continuation
Update for my yesterday's post on Dollar Index.
The market successfully broke the neckline of a triple bottom pattern on 4H.
We see a positive bullish reaction after a retest.
A bullish continuation is expected now to 104.56 / 104.95
 

Attachments

  • dxy.jpg
    dxy.jpg
    100.6 KB · Views: 2
[Here’s why you need proper risk management in trading]
Imagine:
There are two traders, John and Sally.
They both start with a $1,000 account
John is an aggressive trader and he risks $250 on each trade.
Sally is a conservative trader and she risks $20 on each trade.
Both adopt a trading strategy that wins 50% of the time with an average of 1:2 risk to reward.
Over the next 8 trades, the outcomes are Lose Lose Lose Lose Win Win Win Win.
Here’s the outcome for John:
-$250 -$250 -$250 -$250 = BLOW UP
Here’s the outcome for Sally:
-$20 -$20 -$20 -$20 +$40 +$40 +$40 +$40 = +$80
Do you see the power of risk management?
So here’s the deal:
As a trader, you’ll encounter losses regularly.
But with proper risk management, you can contain these losses till it feels like an “ant bite”.
 
GOLD (#XAUUSD): Update & The Thing to Watch
The market keeps coiling on a critical daily horizontal support.
Analyzing a 4H time frame, I spotted a potential inverted head & shoulders pattern.
The price has already completed the left shoulder and the head and currently, it is forming the right shoulder.
1842 - 1850 is its horizontal neckline.
The trigger to buy Gold will be its bullish breakout (4h candle close above).
A bullish continuation will be expected to 1866 / 1879 levels then.
If the price sets a new low, the pattern will become invalid though.
 

Attachments

  • gold.jpg
    gold.jpg
    101.5 KB · Views: 4
#CADJPY: Pullback From Key Level
CADJPY reached a solid horizontal key level yesterday.
The price formed an inverted head & shoulders pattern on that on 1H time frame.
Its neckline was broken then.
I expect a bullish move to 100.0 / 100.25
 

Attachments

  • cadjpy.jpg
    cadjpy.jpg
    103.2 KB · Views: 3
Status
Not open for further replies.
Back
Top