You are using an out of date browser. It may not display this or other websites correctly.
You should upgrade or use an alternative browser.
You should upgrade or use an alternative browser.
My personal FX pairs and XAUUSD analysis
- Thread starter Dominic Walsh
- Start date
- Status
- Not open for further replies.
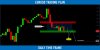
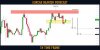
#EURUSD: Waiting For a Breakout
After a strong bearish movement, the pair is consolidating within a narrow horizontal trading range.
1.065 - 1.068 is its support.
I am waiting for its breakout (daily candle close below) to be short.
The pair will most likely drop then.
The goal will be 1.053
After a strong bearish movement, the pair is consolidating within a narrow horizontal trading range.
1.065 - 1.068 is its support.
I am waiting for its breakout (daily candle close below) to be short.
The pair will most likely drop then.
The goal will be 1.053
Attachments
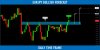
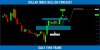
#EURJPY: Important Breakout
EURJPY finally broke and closed above a major horizontal resistance cluster on a daily.
The broken structure turned into a key support now.
I will expect a bullish continuation to 145.0 / 146.3 levels.
Pivot Point Indicator
EURJPY finally broke and closed above a major horizontal resistance cluster on a daily.
The broken structure turned into a key support now.
I will expect a bullish continuation to 145.0 / 146.3 levels.
Pivot Point Indicator
Attachments
[Consistent actions lead to consistent results]
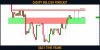
I remembered my first trading system.
It was a Bollinger Band mean reversion strategy.
You buy when the price is at the lower band and sell when it’s at the upper band.
The first few trades I did were winners, then the losses came and I figured this trading strategy doesn’t work.
So, I moved on.
Next, I chanced upon harmonic patterns.
I spent half a year learning how to draw these patterns (guess I’m a slower learner).
At the start, I had some wins but slowly, the losses kicked in and eroded all my profits.
Again, I told myself…
“This trading strategy doesn’t work. Let’s try something else.”
This brought me to the world of price action trading, support and resistance, candlestick patterns, etc.
Again, the same pattern repeated itself.
I had some winners, some losers, and I gave up the strategy.
One day, I asked myself…
“Why does this always happen?”
“Why am I not getting any consistency in my trading?”
“It’s always a few winners and then the losses pile up and take everything away.”
Do you know what I realized?
The problem was me.
I was hopping from one trading strategy to the next.
My actions were inconsistent. And because my actions were inconsistent, I got inconsistent results (duh).
So, don’t make my mistakes.
If you want consistent results from trading, you must have consistent actions.
Stick to one trading strategy, master it—and then move on.
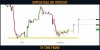
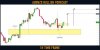
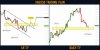
Gold (#XAUUSD): Your Trading Plan For Next Week
 Gold reached a solid horizontal key level this week.
The price formed a doji candle on that on Thursday and then a rejection candle was formed.
We see the attempt of buyers to push.
To catch a pullback, watch a falling parallel channel and a minor horizontal supply zone.
I would suggest waiting for a bullish breakout of these 2. It will most likely trigger the initiation of a correctional movement.
Let 4h candle close above the trend line and a yellow area to confirm the breakout.
Goal will be 1866.
I will monitor this trading setup and post an update later on.
Gold reached a solid horizontal key level this week.The price formed a doji candle on that on Thursday and then a rejection candle was formed.
We see the attempt of buyers to push.
To catch a pullback, watch a falling parallel channel and a minor horizontal supply zone.
I would suggest waiting for a bullish breakout of these 2. It will most likely trigger the initiation of a correctional movement.
Let 4h candle close above the trend line and a yellow area to confirm the breakout.
Goal will be 1866.
I will monitor this trading setup and post an update later on.
Attachments
- Status
- Not open for further replies.