Thanks for answering. A simple chart I do believe is key.Usually around 5-10 per day.
You are using an out of date browser. It may not display this or other websites correctly.
You should upgrade or use an alternative browser.
You should upgrade or use an alternative browser.
To all thee would-be traders out there....
- Thread starter truth101
- Start date
Oh I bet. Must have been filled with indicators, and then you're stuck not knowing what to cause all of them would be pointing in different directions.They didn't always look like that
Thank you for your contribution.
Looking at a chart like that to read the market is like a one-page cliff note for a through experience of the Illiad.
We need to get the display in shape so you can see more of what's there.
Let's introduce a couple of indicators as training wheels. (in a good way)
If you add these three indicators, it will support you in understanding sequences that repeat.
MACD (5,13,6)
Stoch (14,3,1)
Stoch (5,3,2)
The details and background of why these specific parameters is flushed out in the Channels for Building Wealth v2.2 in the ET archives.
Also, search for the thread "Determining Trend" started by dbphoenix circa 2003. It's an oldie put goodie and still applies now as back then.
It you post an updated chart, we can get you going. Also if you would be willing to make it a bar chart it would simplify things.
Best I can do. No Stoch but include MACD:Thank you for your contribution.
Looking at a chart like that to read the market is like a one-page cliff note for a through experience of the Illiad.
We need to get the display in shape so you can see more of what's there.
Let's introduce a couple of indicators as training wheels. (in a good way)
If you add these three indicators, it will support you in understanding sequences that repeat.
MACD (5,13,6)
Stoch (14,3,1)
Stoch (5,3,2)
The details and background of why these specific parameters is flushed out in the Channels for Building Wealth v2.2 in the ET archives.
Also, search for the thread "Determining Trend" started by dbphoenix circa 2003. It's an oldie put goodie and still applies now as back then.
It you post an updated chart, we can get you going. Also if you would be willing to make it a bar chart it would simplify things.
Ok.
Thank you making an effort.
It's like covering one eye as a fast pitch is coming in.
A more useful display will support you so you can see inside the MACD.
Forget the candlesticks, they are eyecandy and not as useful for making money. It took me a long time to let them go. I really enjoyed watching them but I didn't enjoy watching my p&l drawdown.
The next thing you need is a log. We can start with the 30min chart. A row for every 30min bar. You don't have to do this in realtime, more of an exercise to perceive.
What you are tracking are two things with the MACD. The signal line in relationship with the MACD line as well as the histogram as it expands and contracts from zero.
The relationship with the signal line and the MACD line is one of convergence, divergence, crossover long, crossover short, entwined.
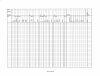
Enclosed is a blank log and a completed one.
Do two days. Fill what you can, non-confront the other columns for now. It's too much information to absorb from the getgo.
Post the log. What did you notice?
btw, this is just a step in one of the most illuminating journey's one could undertake.
In and of itself, it's an incomplete dataset to use to trade. Unless one is ok with long timeframes and gut-wrenching drawdowns with deep pockets to ride out the H's and L's and be satisfied with average returns.
Thank you making an effort.
It's like covering one eye as a fast pitch is coming in.
A more useful display will support you so you can see inside the MACD.
Forget the candlesticks, they are eyecandy and not as useful for making money. It took me a long time to let them go. I really enjoyed watching them but I didn't enjoy watching my p&l drawdown.
The next thing you need is a log. We can start with the 30min chart. A row for every 30min bar. You don't have to do this in realtime, more of an exercise to perceive.
What you are tracking are two things with the MACD. The signal line in relationship with the MACD line as well as the histogram as it expands and contracts from zero.
The relationship with the signal line and the MACD line is one of convergence, divergence, crossover long, crossover short, entwined.
Enclosed is a blank log and a completed one.
Do two days. Fill what you can, non-confront the other columns for now. It's too much information to absorb from the getgo.
Post the log. What did you notice?
btw, this is just a step in one of the most illuminating journey's one could undertake.
In and of itself, it's an incomplete dataset to use to trade. Unless one is ok with long timeframes and gut-wrenching drawdowns with deep pockets to ride out the H's and L's and be satisfied with average returns.
Attachments
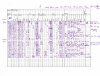
Your completed log looks like my Medical record.
a by-product of one's lifestyle I imagine,...
the opposite of being on a plant based diet.
Looks are not important, results are.Your completed log looks like my Medical record.
At least better than having a medical record as a result of bad trading.
I find it interesting and pleasant in this thread, and also in a number of other newly started threads, that there are so many TA fans and they are discussing TA in a friendly and constructive manner without the usual interruption of those on the other side of the fence. Can't remember ever having seen such on ET in the last 10 years.
Last edited: