Potential NQ Targets

The companion to the daily chart, two up:

View attachment 145716

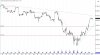
I love how you outline that tiny little range before the open, complete with an equal excursion to test going up and down (outlined by "A" and "B"). Then of course the hinge and the apex which launched the move.

That range for me didn't stand out because I made the fatal mistake of not keeping in mind that price is continuous. With the actual "open" being slightly above this tiny range, it clouded my ability to see this. If in fact I hadn't marked where my open was, then seeing this might have been easier.

But my gosh... does this picture ever tell a thousand words! (at least to the handful of people who know how to read it! :D)
 
No change from yesterday evening. So, once we leave the mean, is it more likely that we run for the upper limit or drop back down to the lower limit?
 
No change from yesterday evening. So, once we leave the mean, is it more likely that we run for the upper limit or drop back down to the lower limit?

The upper limit is certainly the more likely one if we have nothing to go on, but its tricky to make these calls at the mean, correct? Several weeks ago, when we dropped back down to the mean after finally leaving the upper line that we were riding for a while, you said the easy money has already been made. So is this the case now as well?
 
Roffe also made an interesting point yesterday about how in this area some downslopping trendlines appear. In this attached hourly chart, drawing in a SL from the very top at 4120, we see that we are in fact close to touching this trendline if price comes up just a little bit. Would you say this is significant enough to watch? It's at around 4000 right now, so I guess we would have to go up 30 points from here, but this isn't far in the whole grand scheme of things.
 

Attachments

  • SH_ Oct. 22, 2014 06.11.41.jpg
    SH_ Oct. 22, 2014 06.11.41.jpg
    122.3 KB · Views: 70
Roffe also made an interesting point yesterday about how in this area some downslopping trendlines appear. In this attached hourly chart, drawing in a SL from the very top at 4120, we see that we are in fact close to touching this trendline if price comes up just a little bit. Would you say this is significant enough to watch? It's at around 4000 right now, so I guess we would have to go up 30 points from here, but this isn't far in the whole grand scheme of things.

Sounds like the beginning of a hypothesis.
 
I have to say that the best part of this thread is the realization that all but a handful of readers get what you are communicating with these charts.;)


The rest are scratching their heads and wondering where the blotter iso_O.


More likely we're making a PnL


Bullshiters make bullshit

Traders make a PNL

One either is..., or is not

Simple as that

RN
 
Back
Top