Oscillators

for example, we look at the Merrill models, (US dollar index) mark the key points of the Fed and get a fragment of the whole with an unknown continuation and my analysis system, which shows a model of the real price


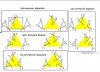
Always 9 price moves One yellow triangle was built, and 2 remained, only 6 movements. Which will be combined - aqua color
 

Attachments

  • Screenshot_2.jpg
    Screenshot_2.jpg
    179.9 KB · Views: 23
  • Screenshot_3.jpg
    Screenshot_3.jpg
    264.2 KB · Views: 26
Last edited:
Still waiting on your definition of 16 now 8 market designs.

From the charts you have posted, it seems that you build your triangles from smaller to larger - alternating between dominance and going through a repeating sequence of events based on your vocabulary.

Your sequence of events are based on a combination of price/volatility data points, although it might have a volume component even though that dimension is not shown.

The ad hominem attacks though don’t really help to progress the conversation.

What is your goal in sharing?
 
Your sequence of events are based on a combination of price/volatility data points, although it might have a volume component even though that dimension is not shown.
The volume component is not considered by me at all, especially since the MT4 terminal is simply not able to take it into account
 
What is your goal in sharing?
I hope that some of you have understood that today I have a unique system for analyzing the market situation that has no analogues in the world. In its effectiveness, it is many times superior to any trading system and is able to work on any instruments and in any time interval.

To implement my commercial offer, I need two assistants who are competent in matters of technical analysis of the market with knowledge of the Russian language.

All questions we can discuss by Skype or Viber
 
The ad hominem attacks though don’t really help to progress the conversation.

What is your goal in sharing?
and the conversation is pointless for the simple reason I use my research, which you have no idea
 
From the charts you have posted, it seems that you build your triangles from smaller to larger - alternating between dominance and going through a repeating sequence of events based on your vocabulary.
think what you want, it your right
 
And what the point of taking into account the volume in the forex market?


You guys have real knowledge gaps in elementary

Do you even know how forex works?
 
Last edited:
and what the point of considering volume in the forex market?


Maybe it’s my mistake, your first post used the ES as an example.

Well simply put, if you don’t understand the role of volume then you also do not have a complete system.

The market’s basic granularity is OHLCVT. Everything else is derived from this moment by moment data flow. To exclude any of the basic data as unessential is not inclusive and therefore incomplete.

I ask one last time - what are the 16/8 market design definitions that you previously mentioned?
 
I ask one last time - what are the 16/8 market design definitions that you previously mentioned?
I already answered here #1 Oct 13, 2019

Each such model has its own time frame of construction and all volatility.
 

Attachments

  • Screenshot_1.jpg
    Screenshot_1.jpg
    67 KB · Views: 28
Maybe it’s my mistake, your first post used the ES as an example.

?
Yes, and these were quotes from the Forex market and on indices the volume of transactions does not matter at all, if you are able to understand what an index is
 
Back
Top