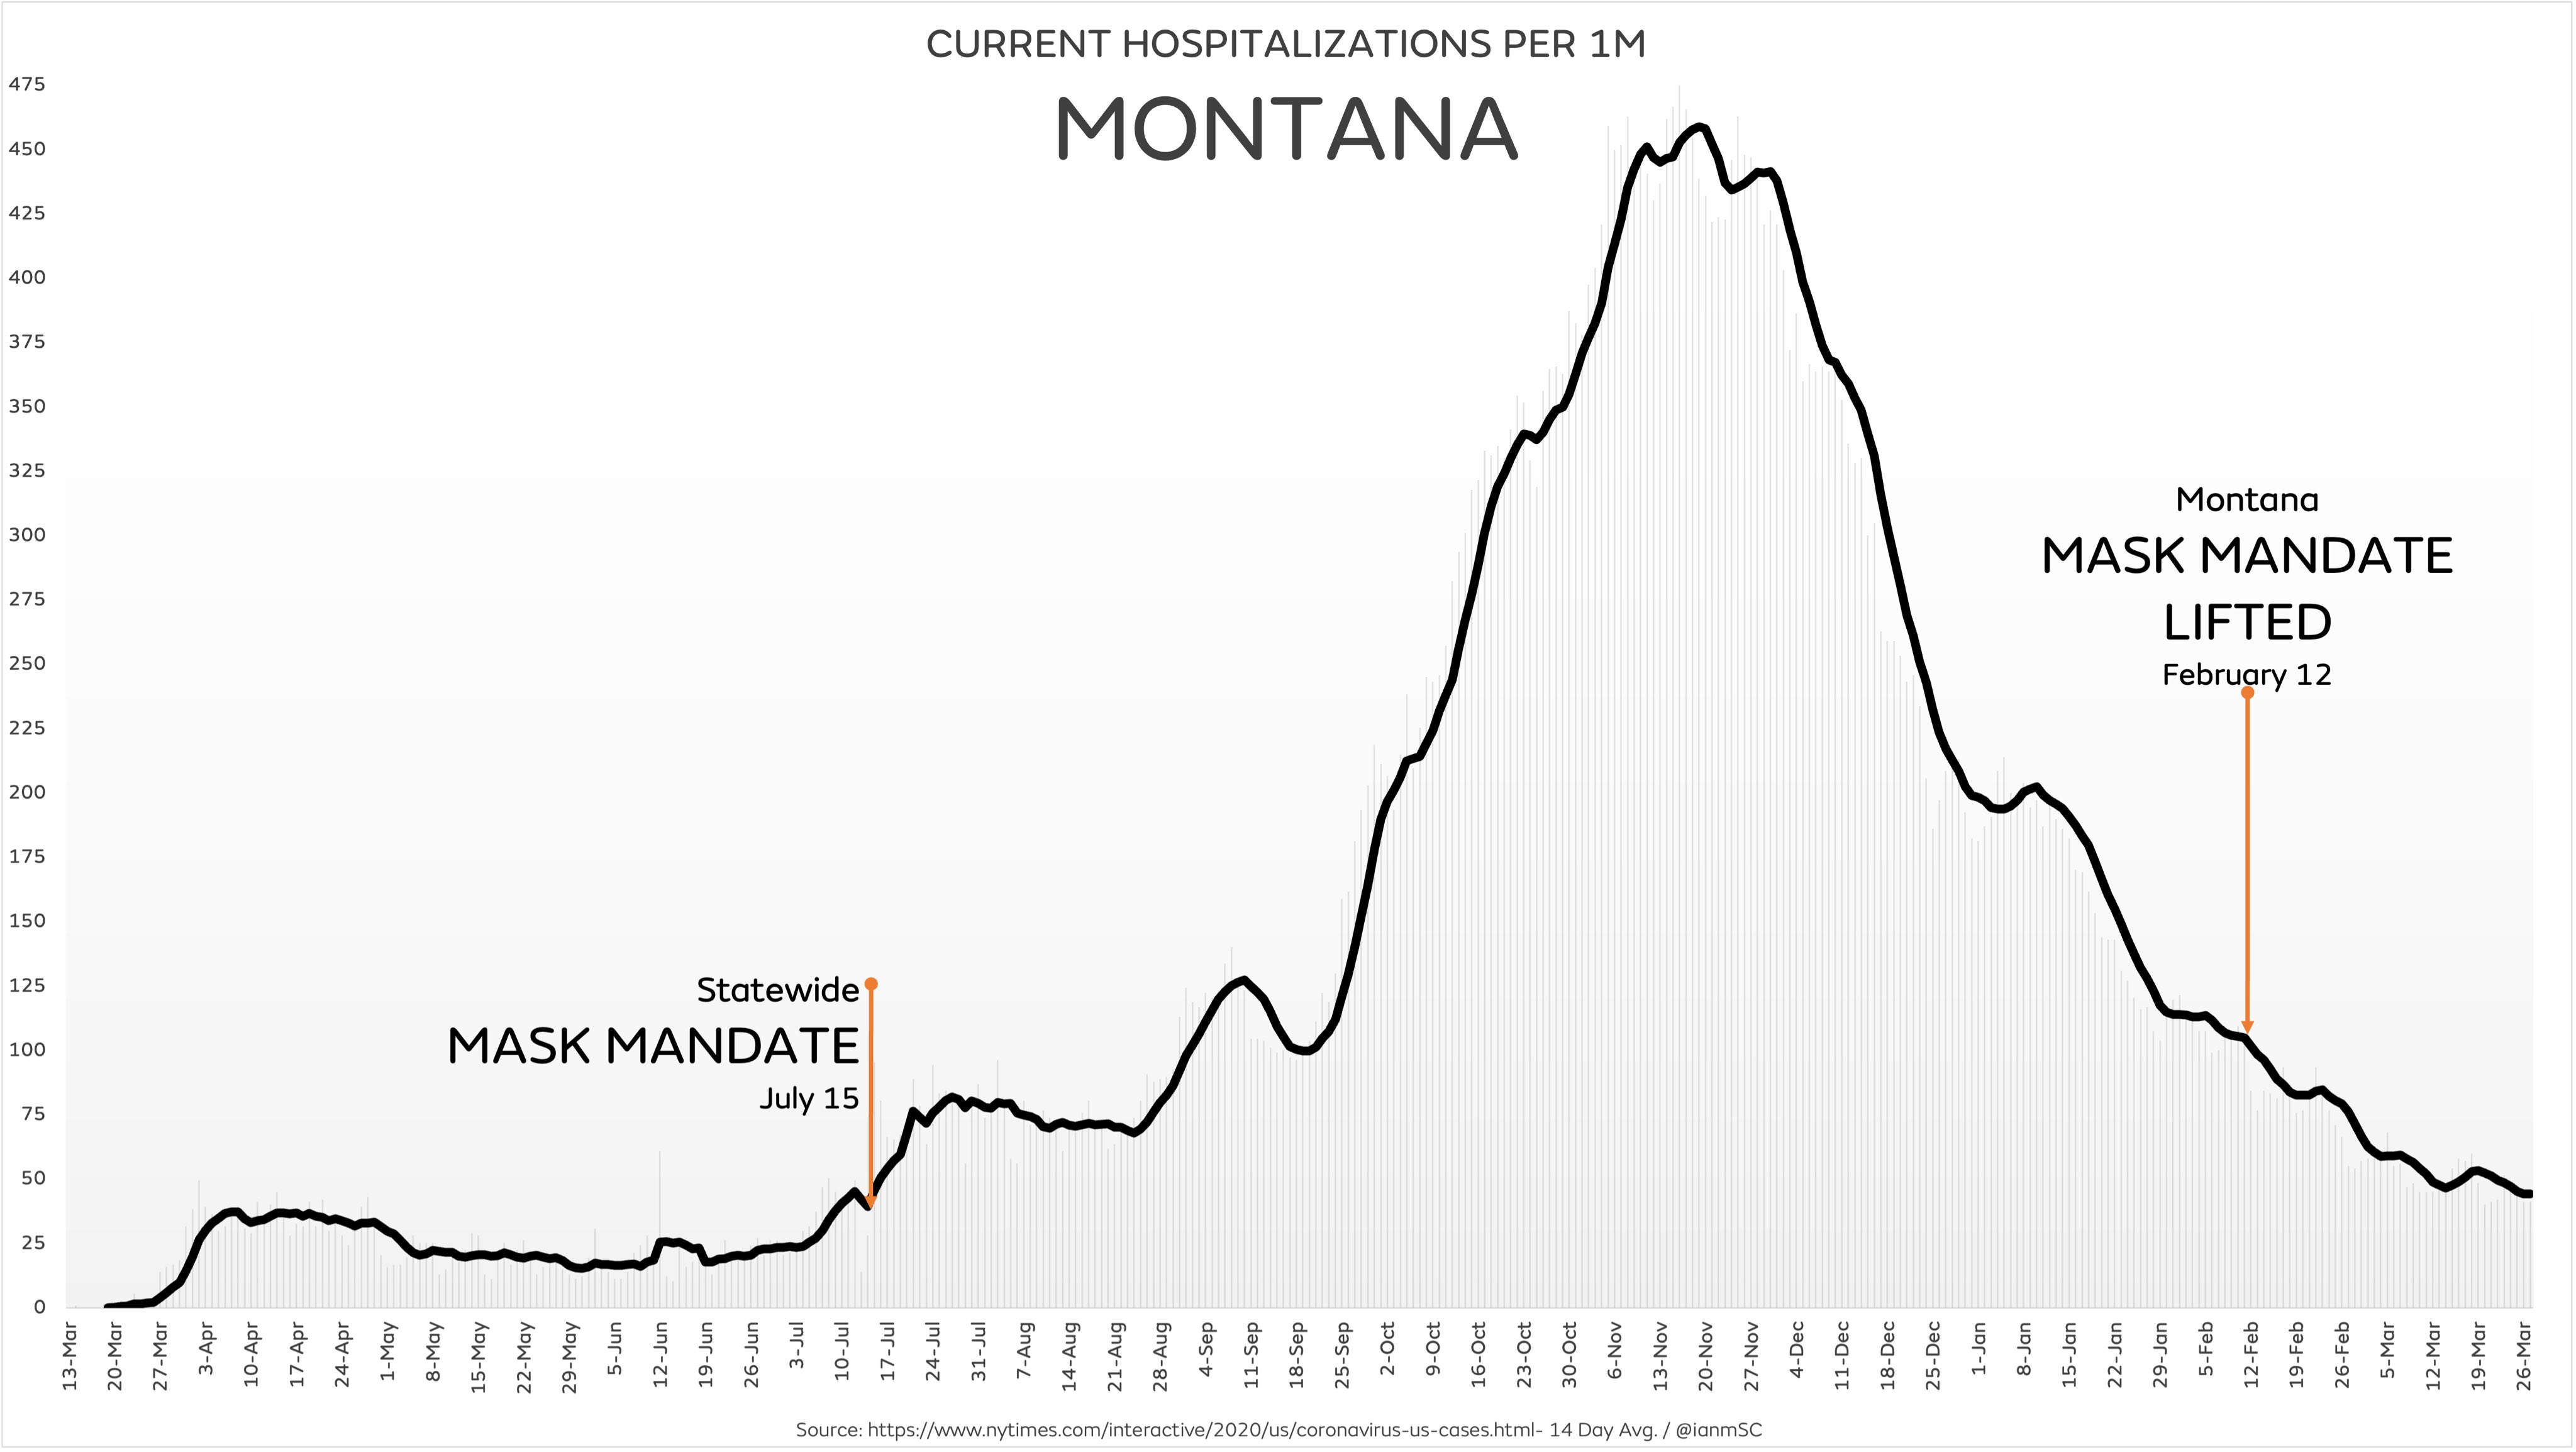
Neanderthals vs. "Science"

how many is multiple?
2 out of dozens?

That does not mean these recent charts are wrong.
I checked a few out myself and they seem to be excellent.

you are just lying your ass off again...

shut the fuck up with your lies and fear mongering...
you and your selfish asshole types are ruining the future for our kids and younger adults.


The data is not accurate on the charts. We showed multiple examples where the data did not match at all the claimed source. So all of them are crap.

Go to reliable mainstream sources for your information -- not COVID-denier crap on Twitter.
 
how many is multiple?
2 out of dozens?

That does not mean these recent charts are wrong.
I checked a few out myself and they seem to be excellent.

you are just lying your ass off again...

shut the fuck up with your lies and fear mongering...
you and your selfish asshole types are ruining the future for our kids and younger adults.

Anyone can create a fabricated chart with scriblings to drive a questionable narrative. This chart is about as truthful as any of the nonsense taken from the Twitter accounts of COVID-deniers.

Florida-joke-chart.png
 
you manifest the capacity for logic of a rock.
again its not about the creator of the chart... its the data.

you act dense on purpose because you are a selfish scared lying piece of crap.


Anyone can create a fabricated chart with scriblings to drive a questionable narrative. This chart is about as truthful as any of the nonsense taken from the Twitter accounts of COVID-deniers.

View attachment 257285
 
So you can post more charts with fabricated data from COVID-deniers on Twitter and Blogs.

We are done refuting over and over again the nonsense you get from fringe lunatics with no credibility. At this point if your source is crap then it is not worth discussing the nonsense you post.

The days of debunking post after post of complete junk from you which you claim is "data" is over.

It's time you used reliable mainstream sources if you want to have a discussion of data.

You do realize you have to show that data is false before you can discount it, right? You can't just say the data isn't to be accepted because it comes from someone you don't like.

That's not how Pre-COVID science works.
 
Anyone can create a fabricated chart with scriblings to drive a questionable narrative. This chart is about as truthful as any of the nonsense taken from the Twitter accounts of COVID-deniers.

View attachment 257285

Except that all of the data is verifiable by outside sources widely available (in the charts I posted). I've even linked to the government sites and news articles, but you don't want to read them. Just plug your ears - because it ruins your fear narrative.
 
You do realize you have to show that data is false before you can discount it, right? You can't just say the data isn't to be accepted because it comes from someone you don't like.

That's not how Pre-COVID science works.

If multiple fact checks show the data from the source is false... then it is time to stop considering nonsense from the source.

Your game of "now prove this data wrong" over & over again... while you regurgitate crap from COVID-Deniers is over.
 
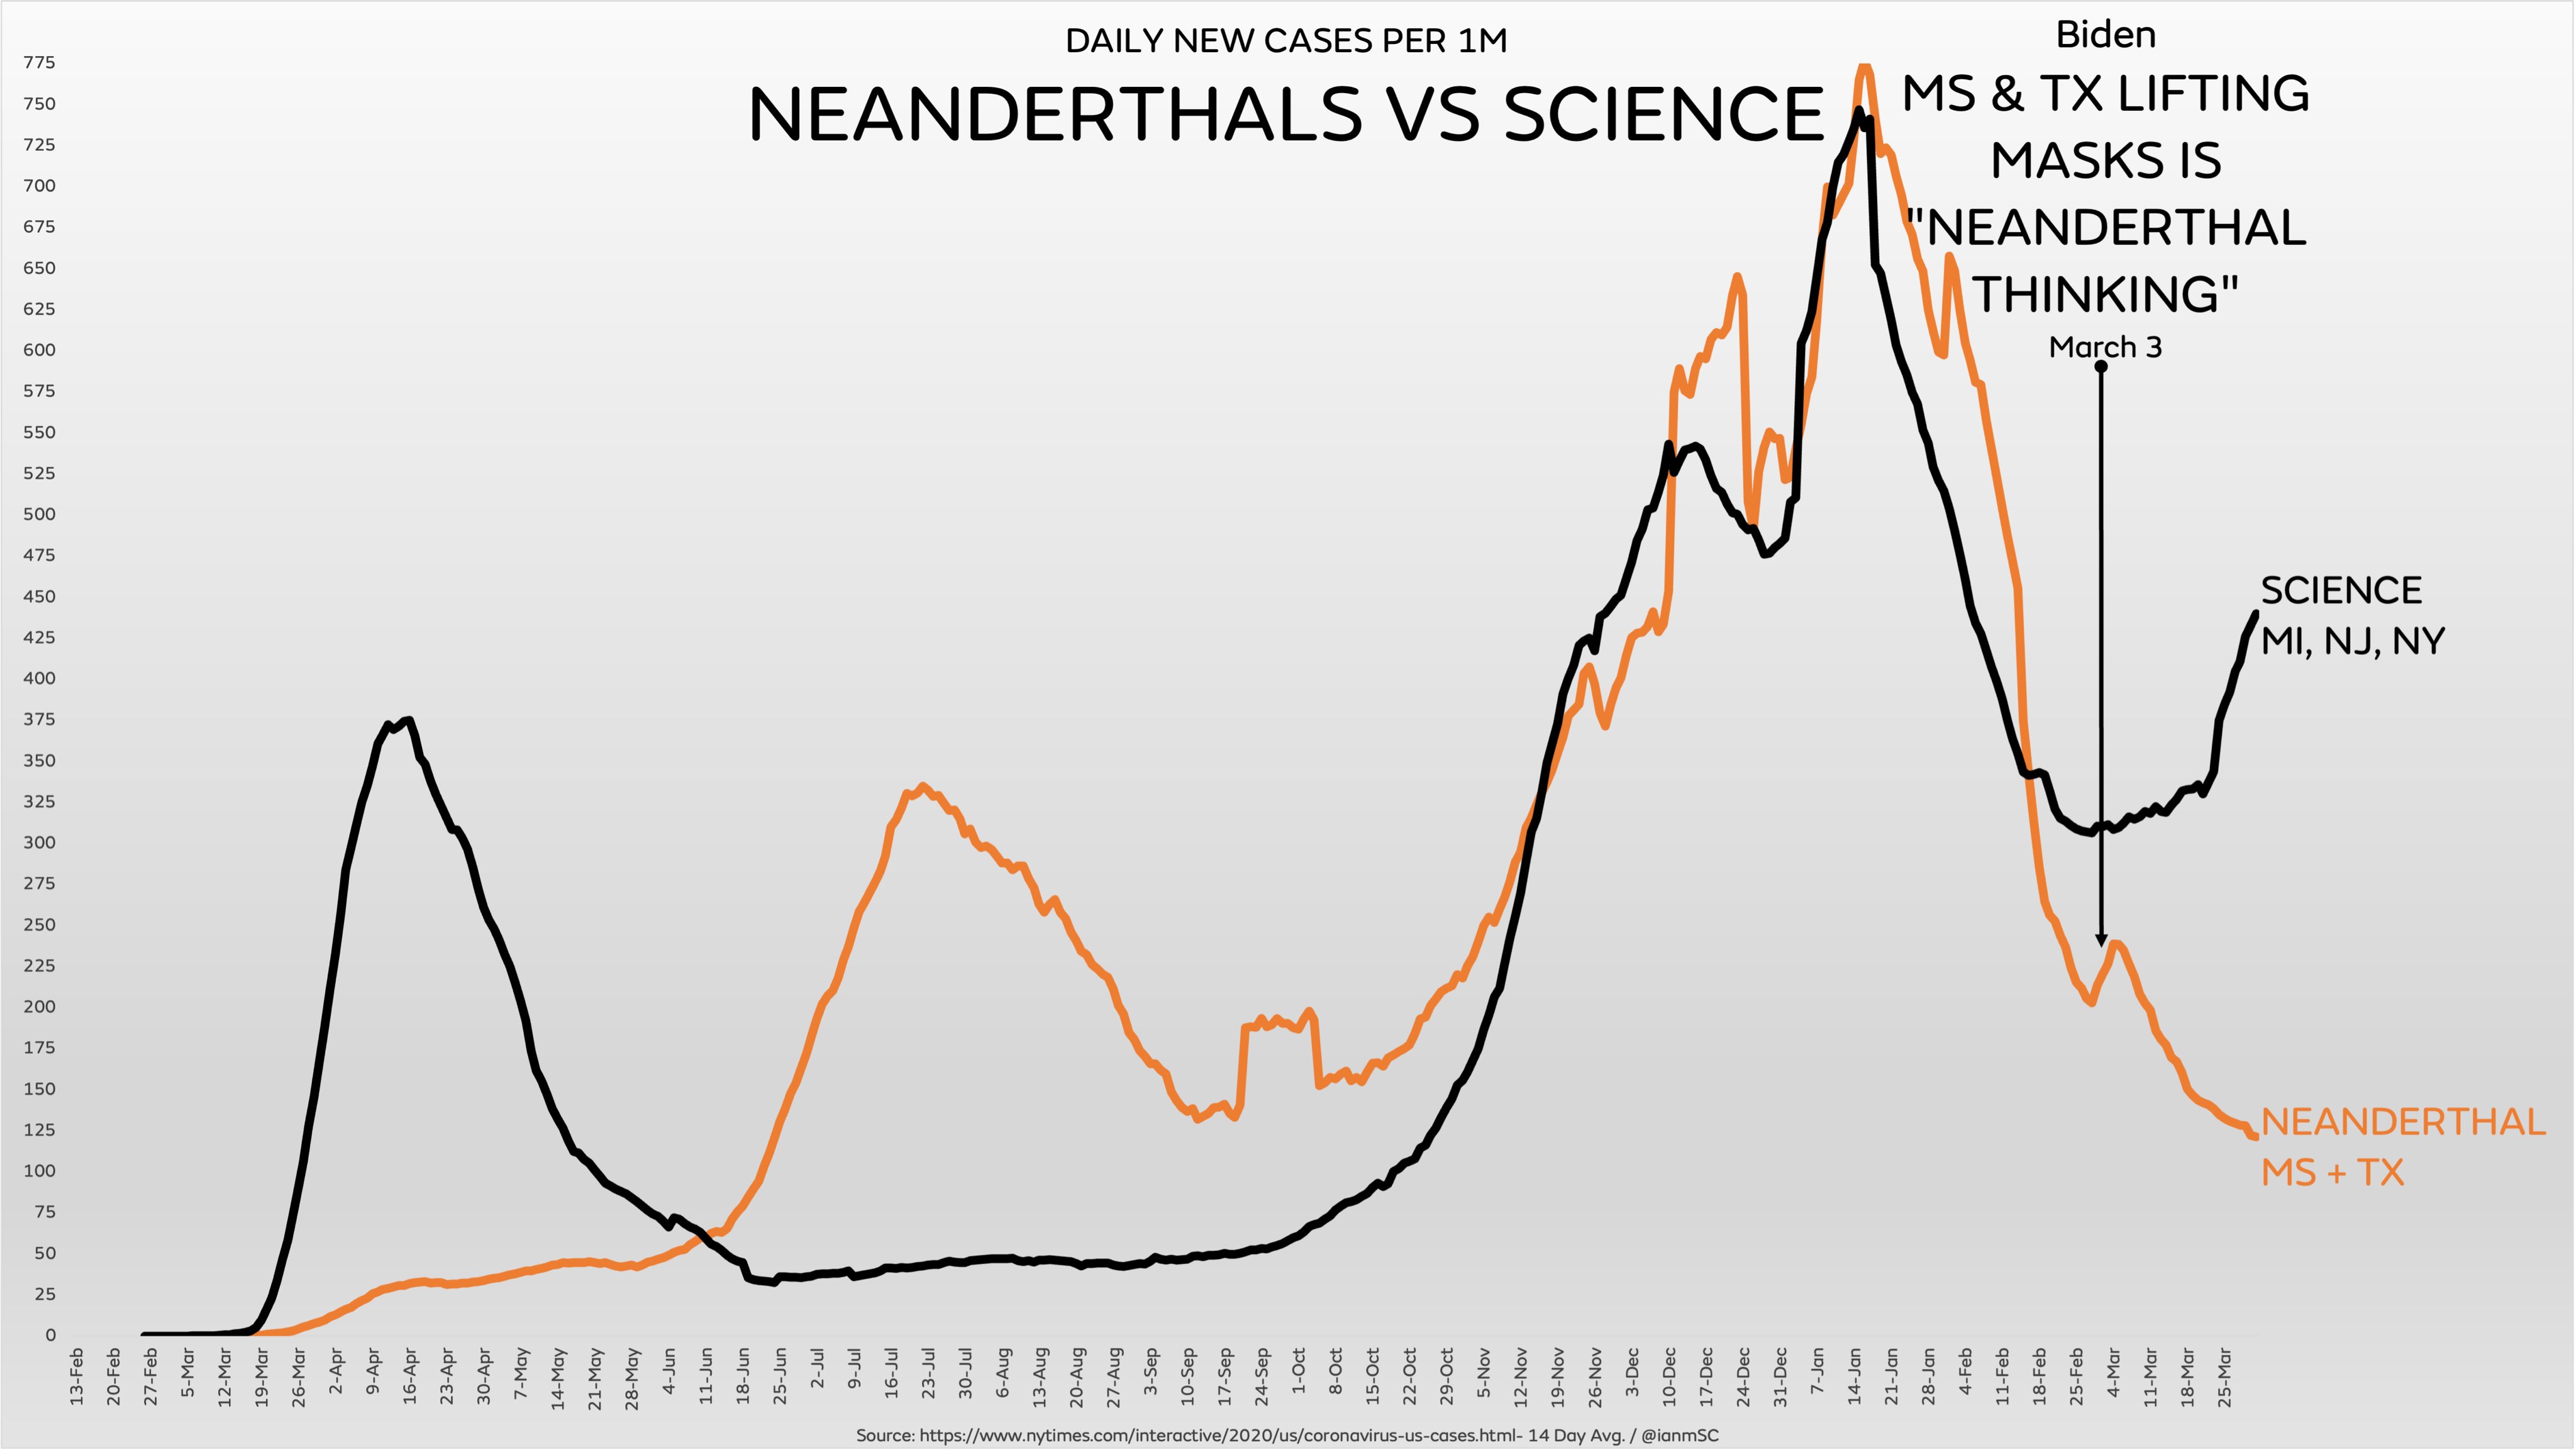
Very first post of the thread. Here was the chart:

Ex5-FWKU8AALa1R


The data comes from here:

The New York Times Interactive on COVID

So you can see it is precisely these states as the NYT shows it.

Biden stating that "lifting masks is Neanderthal Thinking" was on March 3.

Google Search

So I ask you, what is incorrect in this chart?
 
ExvwvzLVcAALbXc


Data from exact same NYTimes interactive as previous two charts. Readily verifiable. Just click the NYT link.

Mask mandate from Rhode Island governor - State website. Exactly as chart states, April 20, 2020.

NBC news article (I can get the CT gov website if you want to verify) where Gov. Lamont from CT signs executive order for masks, April; 17 2020 (exactly as on chart).

Mass state gov. website
stating mask mandate in effect May 1, 2020. Just as it says on the chart.

So what in this chart is incorrect? That's three chances for you to show us this stuff is wrong, GWB. My bet is that you take none of them. Because you're a fake.
 
If multiple fact checks show the data from the source is false... then it is time to stop considering nonsense from the source.

Your game of "now prove this data wrong" over & over again... while you regurgitate crap from COVID-Deniers is over.

Show me the multiple fact checks that say this data is wrong. Hell, show me just one fact check.
 
Last edited:
Back
Top