Compared to you, I’m an idiot in general, only our difference is that I can easily calculate volatility for at least 15 minutes, and even for years, and this is confirmed in my postsResto,
It is clear to all reasonable readers on here that your 'answer' was totally not useful, if not outright confusing... but this has been your modus operandi all along....

You are using an out of date browser. It may not display this or other websites correctly.
You should upgrade or use an alternative browser.
You should upgrade or use an alternative browser.
local volatility model
- Thread starter Baozi
- Start date
I prefer to be an idiot in your eyes, but at the same time know in advance not only the upcoming volatility, but also the nature of the upcoming movement, than to be as smart as you and catch 2-10 pips.Resto,
It is clear to all reasonable readers on here that your 'answer' was totally not useful, if not outright confusing... but this has been your modus operandi all along....
And this is my next forecast out of 300 that I made while testing my system
Attachments


let's admit that the model work....
but how does the model account for the timing of the move? I expect that the vol would be different if the strike was reached tomorrow vs one month from now.
One, don't assume any option model works. It is just a tool.
The model cannot account for time vs speed.i spent a lot of time building one that does what you are thinking. You put in an estimate, then adjust accordingly as it will never be correct goes up fast into your longs..one thing..into your shorts another up down... Was it following a slew..was it vol moved also.. vol was 30 yesterday and now it's 32 so vol is up, but that strike it went to was 33 yesterday so did vol go down??? and on and on. This is why I liked trading stoned. Options make more sense with a good sativa.
This is what I’ll tell you guys, I know perfectly well what your knowledge is based on and what mistakes were originally laid in this knowledge. , My database does not contain these errors, and therefore my forecasts, both in terms of volatility and the nature of the upcoming movement, will always be a million times more accurate
and better to be such an idiot like me than as smart as you
and better to be such an idiot like me than as smart as you
This is what I’ll tell you guys, I know perfectly well what your knowledge is based on and what mistakes were originally laid in this knowledge. , My database does not contain these errors, and therefore my forecasts, both in terms of volatility and the nature of the upcoming movement, will always be a million times more accurate
and better to be such an idiot like me than as smart as you
Wow, are you retarded.

Matt_ORATS
Sponsor
Hi Baozihey all,
anyone here ever tried (or is already using) a local volatility model?
I am trying to implement it with dupire's formula, following the method in this webisite:
https://financetrainingcourse.com/e...cal-volatility-surfaces-in-excel-final-steps/
however after I run the calculation I get "impossible" vols, for one strike for instance I get a value of 22%, one strike after that it jumps to 259%, then goes back to 23%. Any advice? Is there something inherently wrong in the method the website is proposing? Are there known limitations in this model? Does it work only for specific options classes?
And the second question would be.. let's admit that the model works, one thing that I can't wrap my head around is this: local vol is supposed to be the vol that you get when spot goes to a certain strike..correct? but how does the model account for the timing of the move? I expect that the vol would be different if the strike was reached tomorrow vs one month from now. Can someone explain to me the concept in layman terms?
I can explain an approach we take and maybe it will help. Before starting, you should set your purpose of this effort: is it risk management? is it for finding trading opportunities? For us it is both.
The first step is cleaning the quotes and applying good inputs to our modified binomial pricing engine.
Next, we calculate a residual yield based on the put-call parity formula (and sometimes slope the yield as there are different dividend/interest assumptions on high strikes vs low strikes). Applying the residual yield rate process helps with summarizing hard-to-borrow stocks or stocks with differing dividend assumptions. The effect is to line up the call and put implied volatilities.
Next, using the call and put mid-price IVs weighted for moniness and bid-ask width, a non-arbitrageable smooth curve is fit through the strike implied volatilities. Importantly, we use delta as a variable. This smoothing system produces theoretical values and option Greeks, critical for risk management and trading.
We also compute an earnings effect that produces the best fit term structure.
For example, you mention NVDA Jan 31st 2014.

https://gyazo.com/d67f085cff70a8755eb1bbf4a657fe5b
It might be hard to see in this screenshot but the vol50 is the IV at the 50 delta, and using these for each expiration we solve to the earnings effects in the rightmost column. Feb-14 expiration has an earnings effect of 14%.
We also calculate a slope and derivative for each month.
Once we have a slope, the good thing about using delta is you can compare to other stocks and historically. Here's a graph of NVDA slope around the date in question:
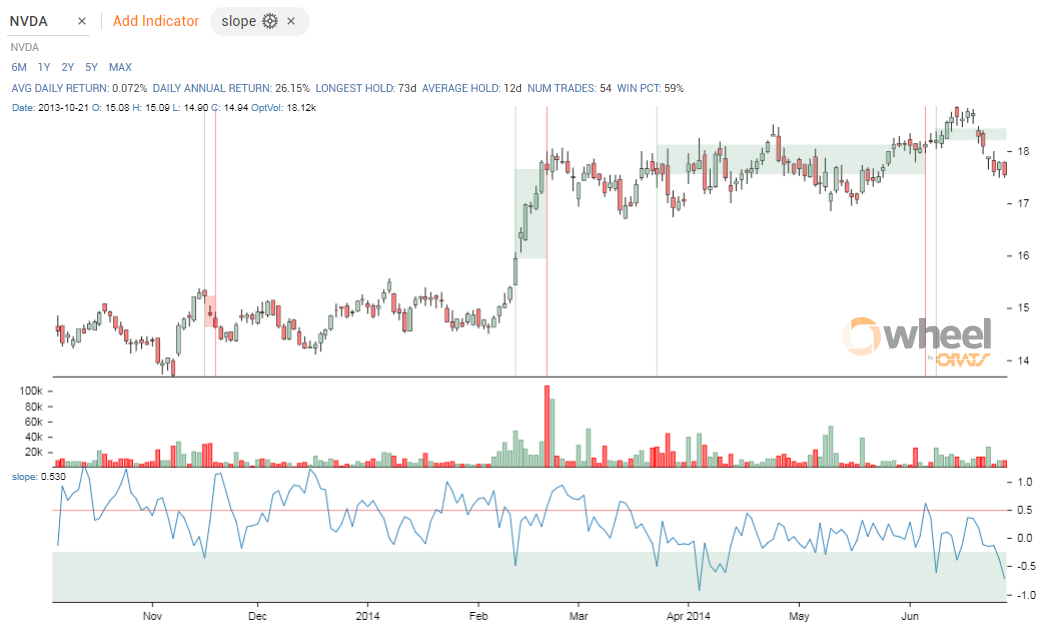
https://gyazo.com/031ace84e4f02bb3dcd9d946a15b89d2
A neat thing in this new graph we have built is to show the stock performance given entry and exit points of indicators like slope. Above if you would have bought NVDA each time the slope crossed below -.25 and sold when it hit .5, you would have had a daily return of 0.072% which translates into an annual return of 26.15%.
For your question about the surface if the spot moves, we handle that by trying to predict what the IV will do on various moves. For example, I have a picture of ZAYO below that shows what happens to IV30 day for historical moves in the stock.
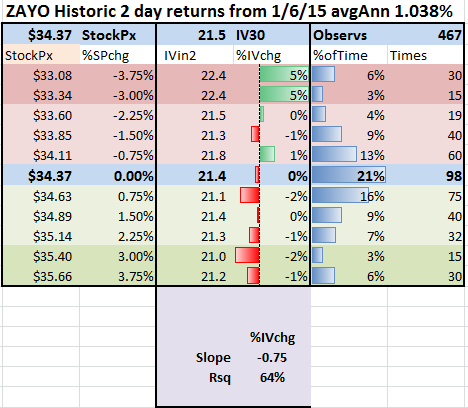
https://gyazo.com/e11ba173b1afe19dfa284e173a2987e7
This shows, not surprisingly, that for each percentage change in the stock the IV30 will change -0.75. We do this type of analysis for IV2year, slope, derivative (skewness, kurtosis) and so we can model what might happen to the IV surface given changes in stock price.
I hope this helps.
Matt

Operator precedence. WTF is wrong with you?
I will give you one clue
the same math problem can be solved in three ways
2 + 2/2= 3
(2 + 2) / 2= 2
2+ (2/2)= 3
If you want to calculate market volatility
Find the only reason for this volatility that mathematicians stubbornly do not see and you will get confirmation automatically
And then it will be easy to calculate this volatility at any time interval, for example - like this
#35 Today at 10:23 AM
PS And do not ask for advice from these morons, it is better to seek the answer yourself
I already heard about this, for example, a freak like you, on the Russian site of traders Smart Lab asked me to show how I can work without stop loss for a day with a leverage of 1k100, for two days in a row I showed it shut upWow, are you retarded.
at the same time there were 12 trading instruments in work!
And currencies and the commodity market and stocks and indices
I am sure I have earned more than you in a year in these two days!
Attachments
Last edited:


Hi Matt,Hi Baozi
I can explain an approach we take and maybe it will help. Before starting, you should set your purpose of this effort: is it risk management? is it for finding trading opportunities? For us it is both.
The first step is cleaning the quotes and applying good inputs to our modified binomial pricing engine.
Next, we calculate a residual yield based on the put-call parity formula (and sometimes slope the yield as there are different dividend/interest assumptions on high strikes vs low strikes). Applying the residual yield rate process helps with summarizing hard-to-borrow stocks or stocks with differing dividend assumptions. The effect is to line up the call and put implied volatilities.
Next, using the call and put mid-price IVs weighted for moniness and bid-ask width, a non-arbitrageable smooth curve is fit through the strike implied volatilities. Importantly, we use delta as a variable. This smoothing system produces theoretical values and option Greeks, critical for risk management and trading.
We also compute an earnings effect that produces the best fit term structure.
For example, you mention NVDA Jan 31st 2014.
https://gyazo.com/d67f085cff70a8755eb1bbf4a657fe5b
It might be hard to see in this screenshot but the vol50 is the IV at the 50 delta, and using these for each expiration we solve to the earnings effects in the rightmost column. Feb-14 expiration has an earnings effect of 14%.
We also calculate a slope and derivative for each month.
Once we have a slope, the good thing about using delta is you can compare to other stocks and historically. Here's a graph of NVDA slope around the date in question:
https://gyazo.com/031ace84e4f02bb3dcd9d946a15b89d2
A neat thing in this new graph we have built is to show the stock performance given entry and exit points of indicators like slope. Above if you would have bought NVDA each time the slope crossed below -.25 and sold when it hit .5, you would have had a daily return of 0.072% which translates into an annual return of 26.15%.
For your question about the surface if the spot moves, we handle that by trying to predict what the IV will do on various moves. For example, I have a picture of ZAYO below that shows what happens to IV30 day for historical moves in the stock.
https://gyazo.com/e11ba173b1afe19dfa284e173a2987e7
This shows, not surprisingly, that for each percentage change in the stock the IV30 will change -0.75. We do this type of analysis for IV2year, slope, derivative (skewness, kurtosis) and so we can model what might happen to the IV surface given changes in stock price.
I hope this helps.
Matt
I am an avid user of your product. I was wondering if you can expand a bit on the "earnings effect" variable.
As well, I backtested the "slope" parameter on NVDA with a bunch of combinations (-.5, 1), (-.25,.5) etc.. However my results are a bit different than what you posted. On my screen the slope for NVDA only went below -.25 a few times. My results were also not that great. I don't usually use the "slope" feature but your post got me interested. Maybe you could talk a little more about it? Thanks mat I look forward to listening.
Below are my results for - buy 100 shares below -.25 and close the position when slope goes above .5. As well as a table of the best performing combos.
I would up load a data table so you could look at the CSV for the trades but I am not to sure you'd be okay if I shared your data.
Thanks