local volatility model

look at here,https://birga-trade.com/zhizhilev.html

this is specifically a mathematical model - https://birga-trade.com/zhizhilev52.html

this author is much more believable unlike others, in his calculations on modeling and volatility there is only one error, and in your version there are at least 3 errors


The problem with any mathematical model is that the authors use the phrase “in the form of a random process forming filter” or “white noise”, in fact there is no place for randomness in the market, everything is clear and regular, just no one can find this secondary pattern

Oh wow, this morning I woke up all excited to read the replies to my question that had poured overnight..

..and then I discovered that a good chunk was related to this. :banghead:
 
Most people seem to be citing the same issue: the data should be adjusted/smoothed before attempting the calculation, and this is probably a good part of my problem, as I am using the last traded price as the main input. I would say that in my market the bid-ask is very tight, however It's definitely something I should look up. Thanks for your help guys.

Also: within what delta range is this model reliable? From many posts I read around these forums seems that it's somewhere in the +/-25~30 range. Can someone confirm?
 
Most people seem to be citing the same issue: the data should be adjusted/smoothed before attempting the calculation, and this is probably a good part of my problem, as I am using the last traded price as the main input. I would say that in my market the bid-ask is very tight, however It's definitely something I should look up. Thanks for your help guys.

Also: within what delta range is this model reliable? From many posts I read around these forums seems that it's somewhere in the +/-25~30 range. Can someone confirm?

10, 25, ATM (OTC stuff).
 
Last edited:
Oh wow, this morning I woke up all excited to read the replies to my question that had poured overnight..

..and then I discovered that a good chunk was related to this. :banghead:

I tend to have semantic issues quite often as I call things what I am familiar with calling them.
Maybe I missed the objective as Matt's response was way out in left field with what I thought.

Are you trying to understand how vol moves between present at the money vol and the vol you see in the individual strikes, as the market price moves to those strikes????

Fortunately my next post will be from my PC - been all over the place the last 2 weeks, finally home.
 
I tend to have semantic issues quite often as I call things what I am familiar with calling them.
Maybe I missed the objective as Matt's response was way out in left field with what I thought.

Are you trying to understand how vol moves between present at the money vol and the vol you see in the individual strikes, as the market price moves to those strikes????

Fortunately my next post will be from my PC - been all over the place the last 2 weeks, finally home.

ok no worries.. and yes, of course the final target would be to have a better understanding of IV changes across time/strikes.

In any case, I found the answer to my own question regarding the time issue.. I rechecked dupire's formula and actually there are two inputs T1 and T0, so the time horizon is clearly defined.
 
Hi Matt,
I am an avid user of your product. I was wondering if you can expand a bit on the "earnings effect" variable.
As well, I backtested the "slope" parameter on NVDA with a bunch of combinations (-.5, 1), (-.25,.5) etc.. However my results are a bit different than what you posted. On my screen the slope for NVDA only went below -.25 a few times. My results were also not that great. I don't usually use the "slope" feature but your post got me interested. Maybe you could talk a little more about it? Thanks mat I look forward to listening.

Below are my results for - buy 100 shares below -.25 and close the position when slope goes above .5. As well as a table of the best performing combos.
View attachment 212587
View attachment 212586
View attachment 212588

I would up load a data table so you could look at the CSV for the trades but I am not to sure you'd be okay if I shared your data.
Thanks
Hi TheBigShort
Thanks for being a subscriber.
I'll expand on the how we calculate the earnings effect defined as the amount of extra implied volatility in each expiration due to the expected move after an earnings announcement.

To remove the implied earnings effect in the IV, ORATS follows these steps.
  • Apply accurate earnings announcement dates to determine how many earnings apply to each expiration;
  • Solve for an earnings move that makes the most rational resultant ex-earnings effect monthly implied volatility relationships;
  • Present monthly and constant maturity readings historically.
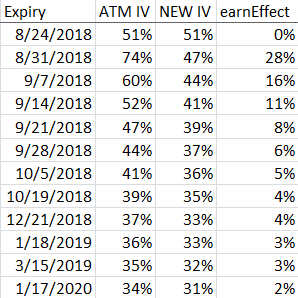
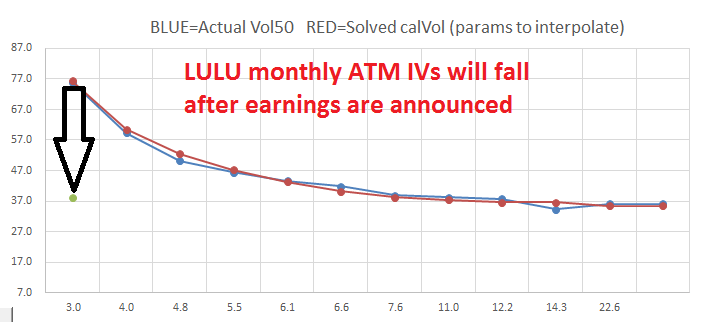
For example, consider LULU that announced earnings 8/30/2018 after the close. Presented below is the method for extracting earnings from IV. See the at-the-money IVs for each expiration, post removal of earnings effect IV, and that portion of the IV that is applicable to the earnings announcement move:


The 8/25/2018 expiry does not have an earnings effect. 8/31/2018 has the largest earnings effect (since the earnings effect will have a greater percentage of days relative to the number of days to expiration). Notice how the method solves for a remaining NEW IV skew that is still down sloping (backwardation).


I hope this helps.
Matt
 
Back
Top