You would do well to read this, Ricter, though I won't hold my breath in hopes you will. Judy probably won't give it a second glance, preferring to remain "ignant" for the rest of his isolated life.
April 4, 2011
Will the Real Phillips Curve Please Stand Up? John P. Hussman, Ph.D.
Much of the intellectual basis for the Federal Reserve's dual mandate - "to promote effectively the goals of maximum employment, stable prices, and moderate long-term interest rates" - is based on the belief in what economists call the Phillips Curve. The Phillips curve, named after economist A.W. Phillips, is widely understood as a "tradeoff" between inflation and unemployment. The idea is so engrained in the minds of economists and financial analysts that it is taken as obvious, incontrovertible fact. High unemployment, the argument goes, is associated with low inflation risk, and in that environment, policy makers can safely pursue measures targeted at increasing employment, without undesirable consequences for inflation.
You can see this blind acceptance of Phillips Curve thinking in Ben Bernanke's go-out-and-speculate Op-Ed in defense of quantitative easing, which appeared in the Washington Post late last year:
"The Federal Reserve's objectives - its dual mandate, set by Congress - are to promote a high level of employment and low, stable inflation... low and falling inflation indicate that the economy has considerable spare capacity, implying that there is scope for monetary policy to support further gains in employment without risking economic overheating. The FOMC decided this week that, with unemployment high and inflation very low, further support to the economy is needed."
In prior weekly comments, we've reviewed the weakness in Bernanke's argument that stock market fluctuations influence GDP, noting that every 1% change in market value is associated with a short-lived change of only 0.03-0.05% in real GDP. That result is strongly rooted in economic theory, since consumption and wealth effects are based on assets that are viewed to be "permanent," not on fluctuations in assets that are known to be volatile.
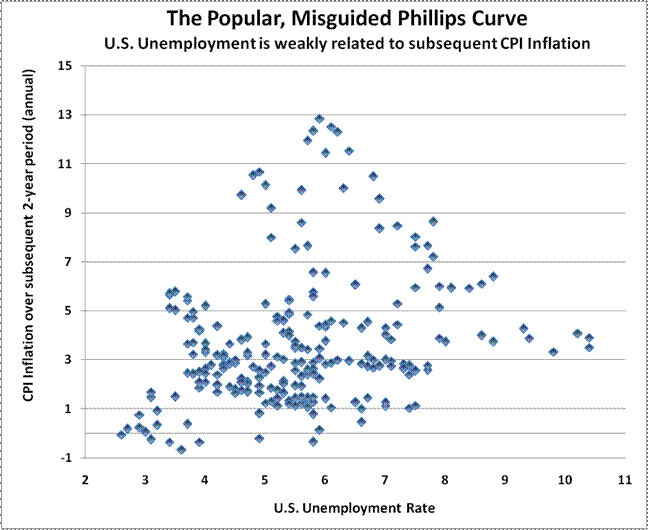
Similarly, Bernanke's belief in the Phillips Curve is equally devoid of factual substance, despite its broad acceptance and simplistic appeal. The chart below shows the historical record, since 1947, plotting the U.S. unemployment rate against the subsequent rate of CPI inflation over the following 2-year period. The correlation is essentially zero (techically, it's slightly positive, implying no "tradeoff" at all in historical data). I should also note that the same lack of correlation holds between unemployment and inflation measured over the previous 1-2 year period.
As it happens, economists have been well aware of this lack of correlation for decades, but because of the simple intellectual appeal of an inflation-unemployment tradeoff, they have gone to great lengths to try to make the relationship work. The most prominent version of this is the "expectations augmented" Phillips Curve, which looks at the graph above as a whole set of "nested" Phillips Curves (like indifference curves in consumer theory), where each curve is set at a different level based on the level of expected inflation. In this view, unexpected inflation moves you along a given Phillips Curve, while expected inflation shifts you to a different curve. While this version of the theory is popular among economists because it gives them a modeling "environment" in which to teach the importance of expectations and so forth, the fact remains even the expectations-augmented version has only a weak relationship to actual economic data.
In effect, the most basic intellectual underpinning of the Fed's "dual mandate" is Grade-A horse manure.
How can that be? Didn't A.W. Phillips demonstrate the inflation-unemployment tradeoff in historical data, giving rise to the famous curve that bears his name?
Well, actually, no.
See, the Phillips Curve takes its name from a 1958 Economica paper by A.W. Phillips, which studied the relationship between unemployment and
wage inflation in Britain, using a century of historical data through the 1950's. What Phillips found was this: when unemployment was low, wage inflation tended to be above-average, and when unemployment was high, wage inflation tended to be subdued.
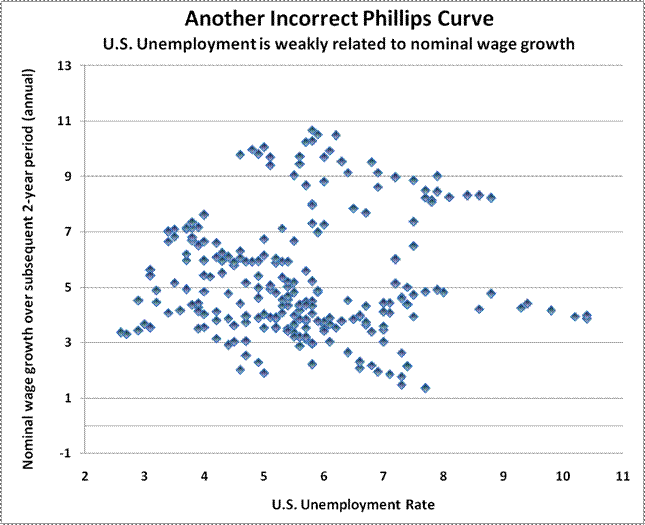
Yet even this relationship, when viewed in U.S. data since 1947, doesn't seem to hold up very well. In fact, U.S. unemployment is just as weakly related to nominal wages as it is with overall price inflation.
We can get to the heart of the Phillips Curve by asking one crucial question: What is the difference between Britain in the period from 1861-1957, and the United States in the post-war period?
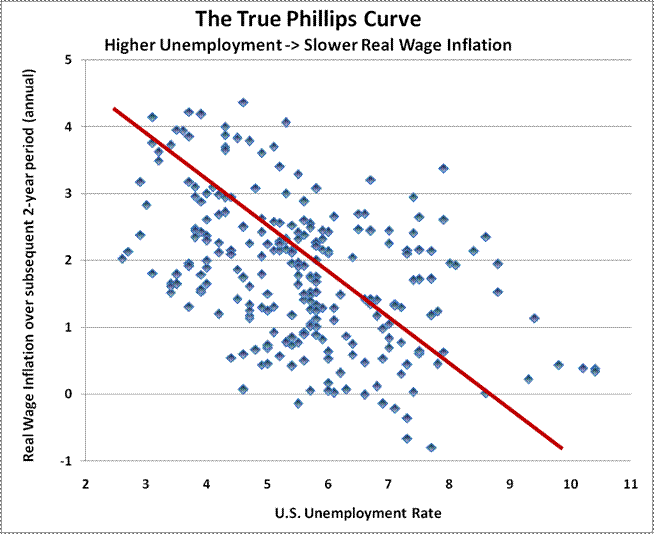
The answer is simple. During most of the period that Phillips studied, Britain was on the gold standard. As a result, the general price level was actually very stable, with very little general price inflation at all. In fact, Phillips excluded data "in or immediately after those years in which there was a very rapid rise in import prices." So when Phillips observed wage inflation, he was actually observing real wage inflation as well. When unemployment was low and available labor was scarce, workers were able to command a greater amount of real goods and services in return for their work. In contrast, when unemployment was high and available labor was plentiful, workers found that their standard of living typically did not rise quickly because their services were not in sufficient demand.
Phillips demonstrated a principle that is well-known to every economist: very simply, when a useful resource becomes scarce, its price tends to increase relative to the prices of other goods and services. That finding doesn't need all sorts of intellectual contortions or modeling tricks to make it "work," because it is one of the most basic laws of economics.
(cont'd below)