Building a live account 2 - US$1,000 to more than US$200,000 in 30 years

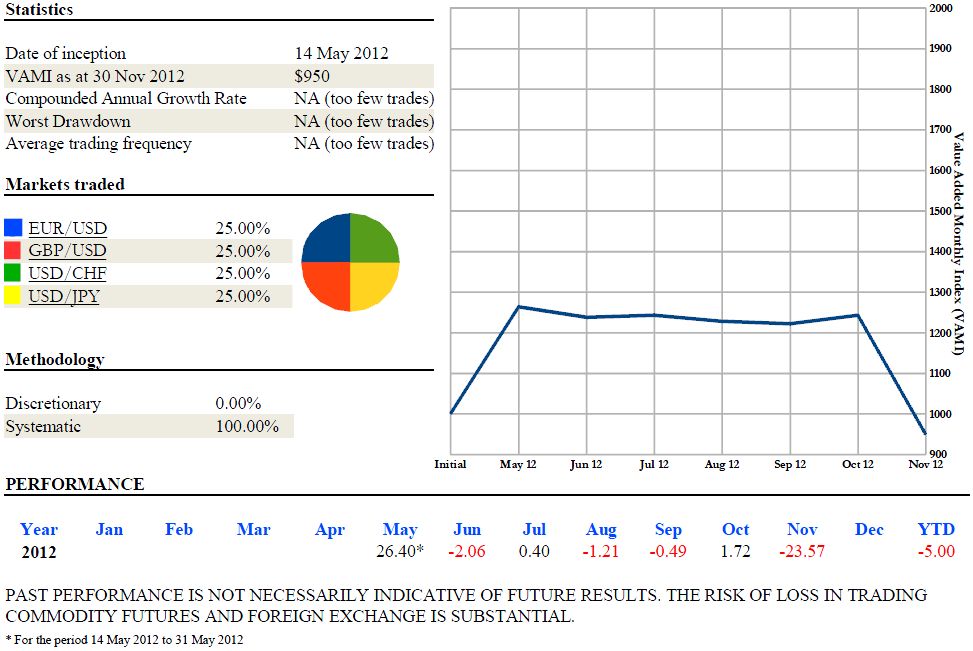
Performance for the week ended 30 November 2012: <font color="red">-7.73%</font>

Opening VAMI: $1029
Gains/(Losses): <font color="red">($79)</font>
Closing VAMI: $950

20121130-chart-satc.jpg
 
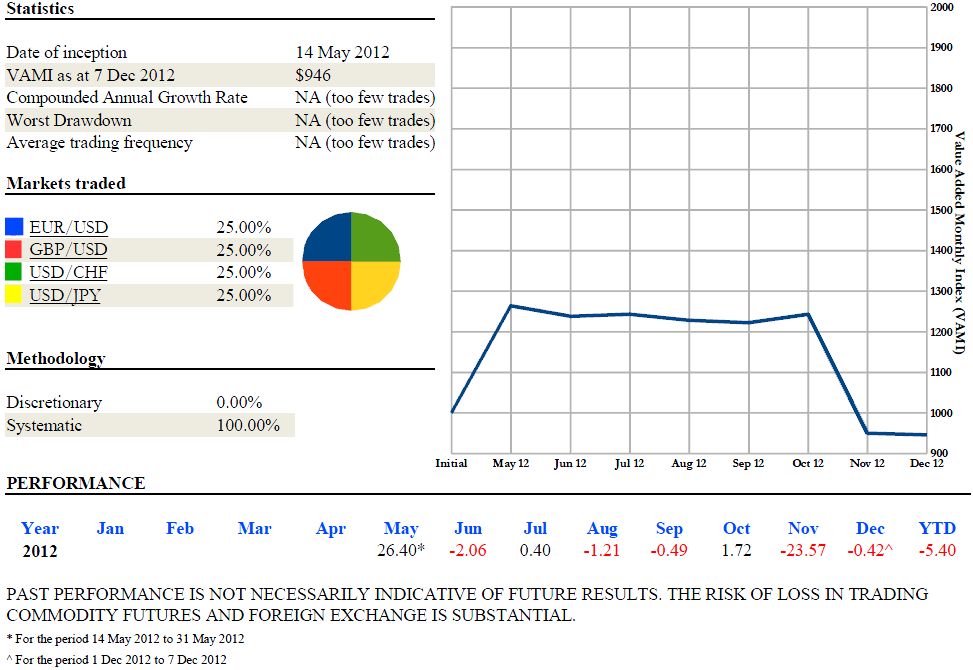
Performance for the week ended 7 December 2012: <font color="red">-0.42%</font>

Opening VAMI: $950
Gains/(Losses): <font color="red">($4)</font>
Closing VAMI: $946

20121207-chart-satc.jpg
 
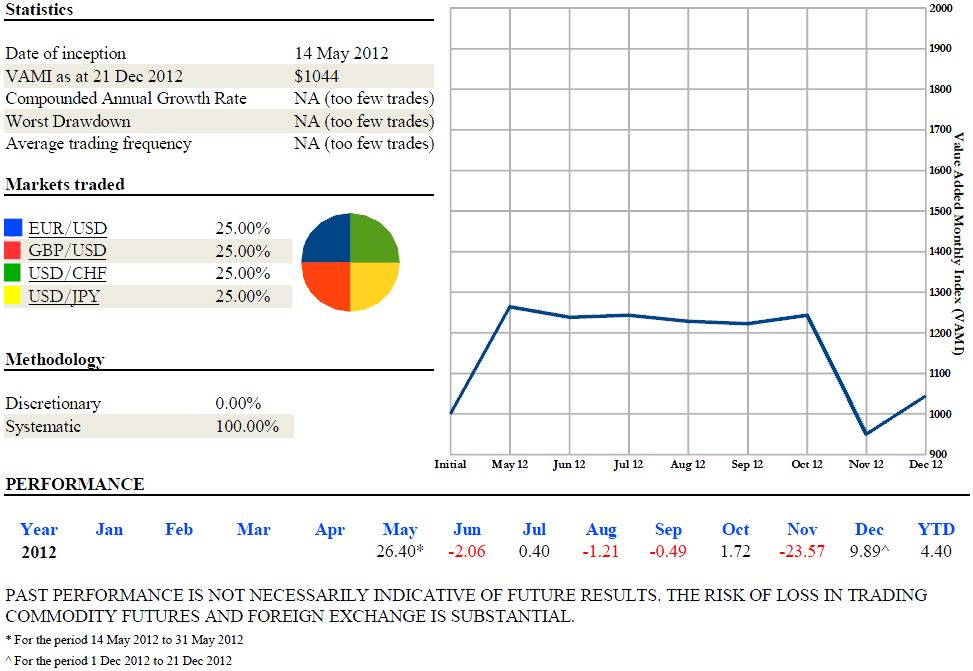
Performance for the week ended 21 December 2012: <font color="red">-2.44%</font>

Opening VAMI: $1070
Gains/(Losses): <font color="red">($26)</font>
Closing VAMI: $1044

20121221-chart-satc.jpg
 
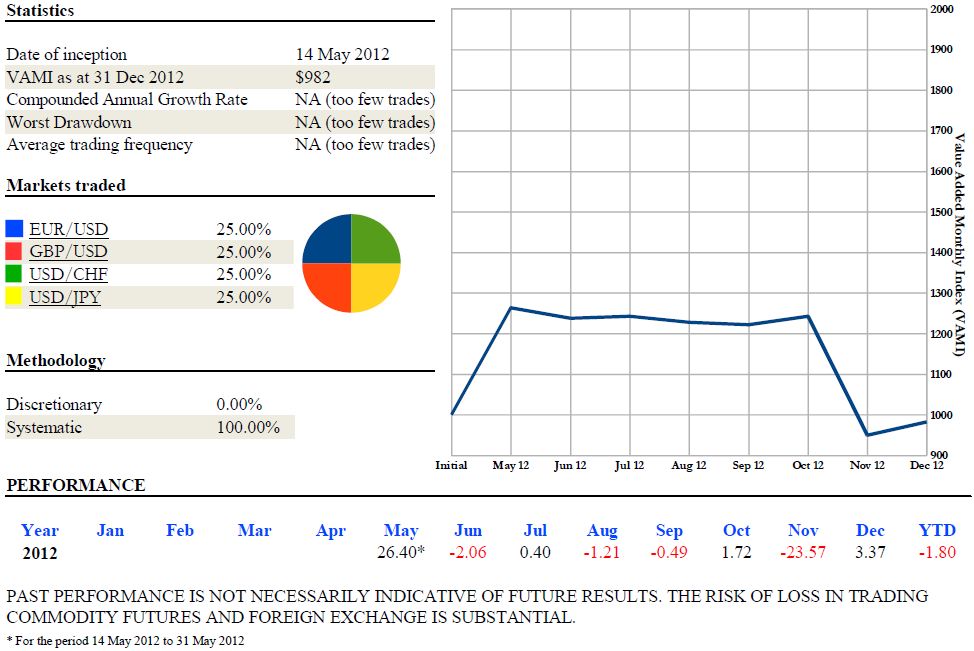
Performance for the period 24 December 2012 to 31 December 2012: <font color="red">-5.89%</font>

Opening VAMI: $1044
Gains/(Losses): <font color="red">($62)</font>
Closing VAMI: $982

20121231-chart-satc.jpg
 
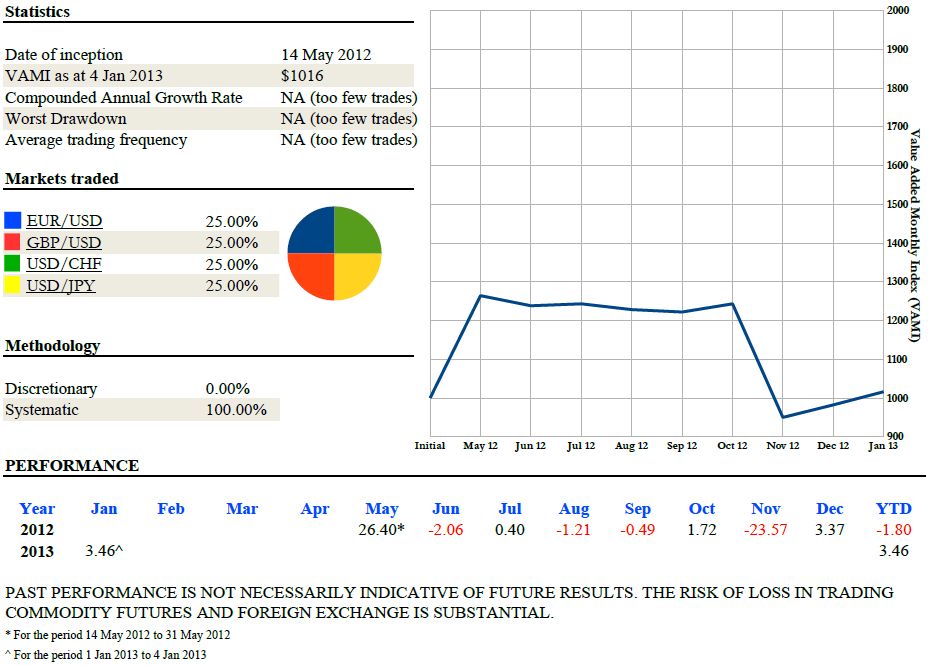
Performance for the period 1 January 2013 to 4 January 2013: +3.46%

Opening VAMI: $982
Gains/(Losses): $34
Closing VAMI: $1016

20130104-chart-satc.jpg
 
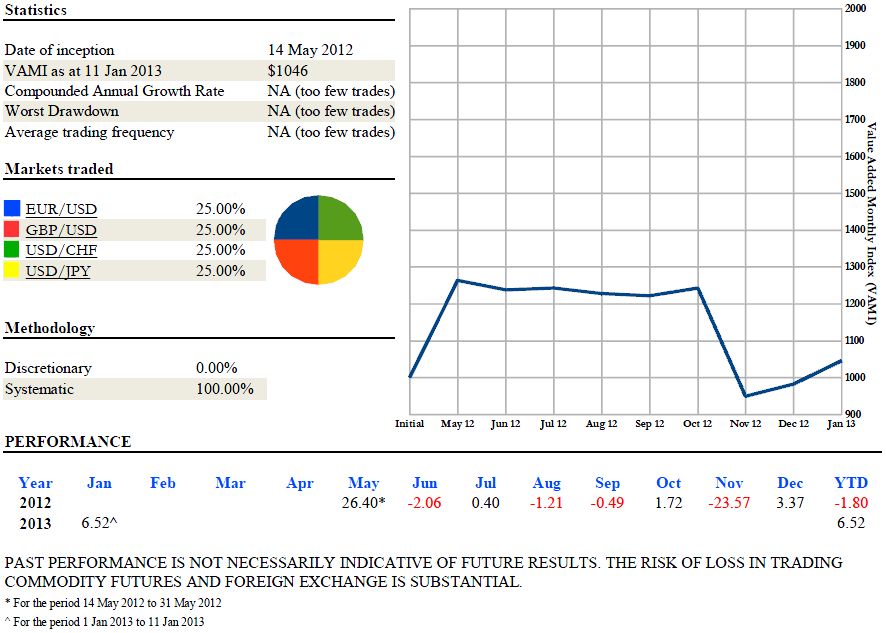
Performance for the period 1 January 2013 to 11 January 2013: +2.95%

Opening VAMI: $1016
Gains/(Losses): $30
Closing VAMI: $1046

20130111-chart-satc.jpg
 
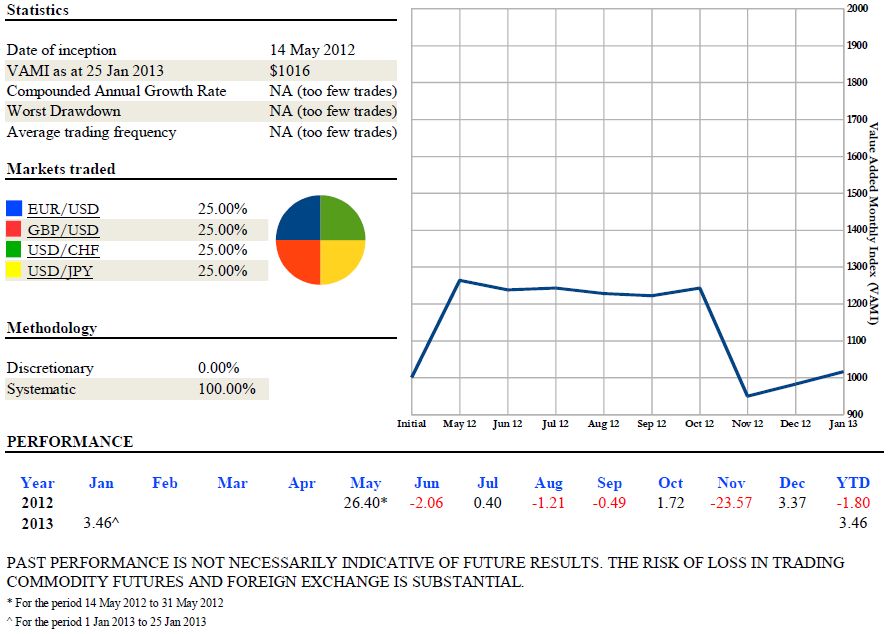
Performance for the period 12 January 2013 to 25 January 2013: <font color="red">-2.87%</font>

Opening VAMI: $1046
Gains/(Losses): <font color="red">($30)</font>
Closing VAMI: $1016

20130125-chart-satc.jpg
 
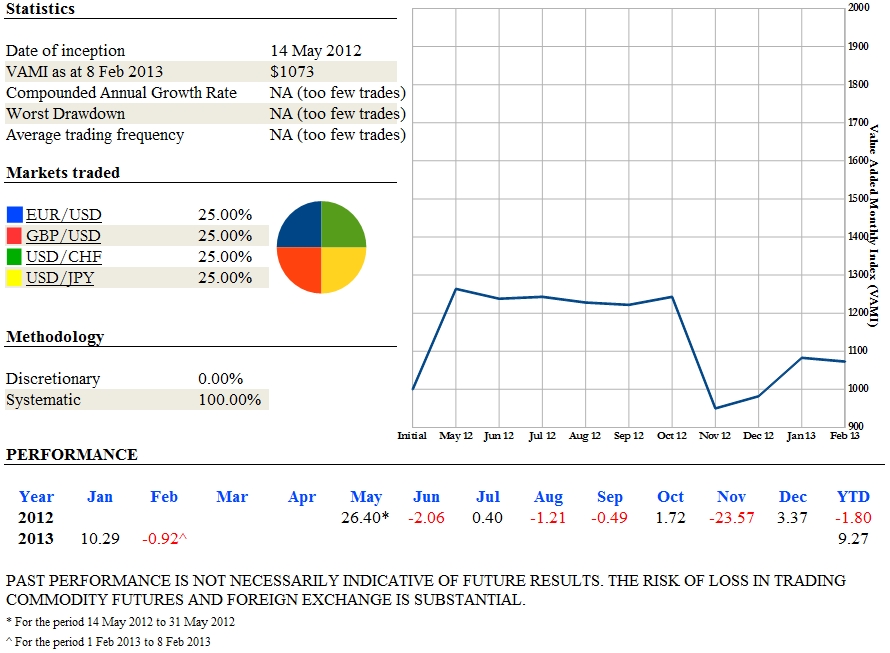
Performance for the week ended 8 February 2013: <font color="red">-4.88%</font>

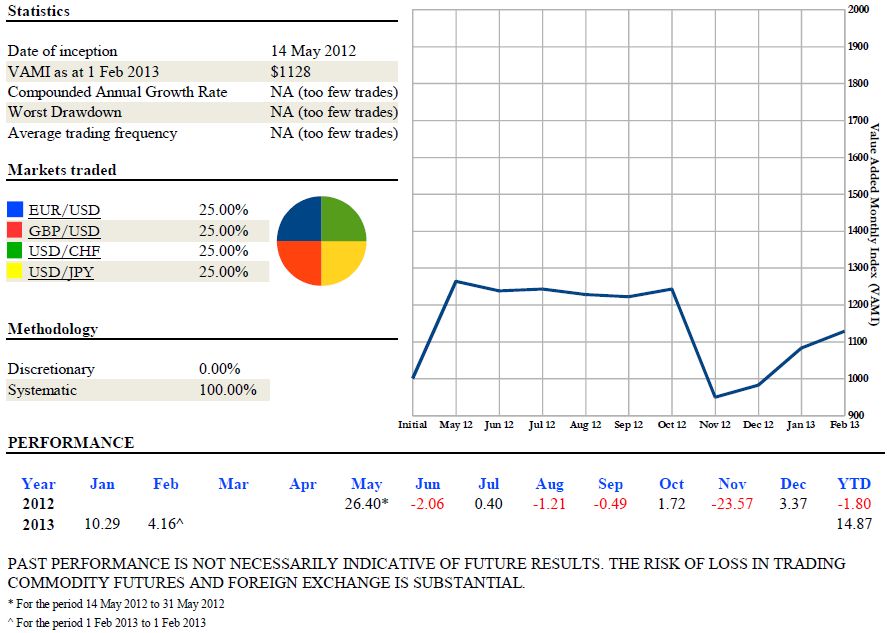
Opening VAMI: $1128
Gains/(Losses): <font color="red">($55)</font>
Closing VAMI: $1073

satc-20130208.jpg
 
Back
Top