Building a live account 2 - US$1,000 to more than US$200,000 in 30 years

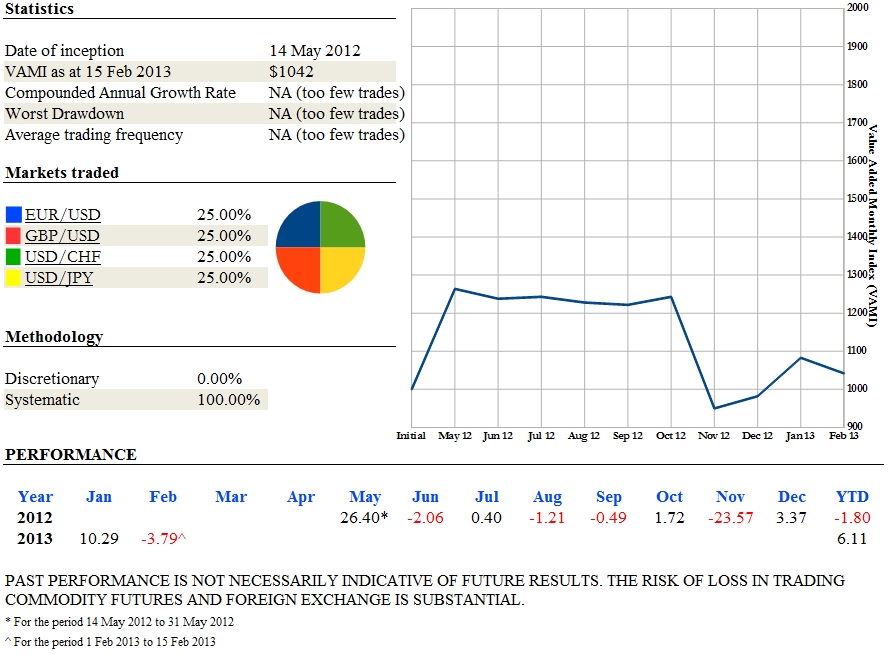
Performance for the week ended 15 February 2013: <font color="red">-2.89%</font>

Opening VAMI: $1073
Gains/(Losses): <font color="red">($31)</font>
Closing VAMI: $1042

satc-20130215.jpg
 
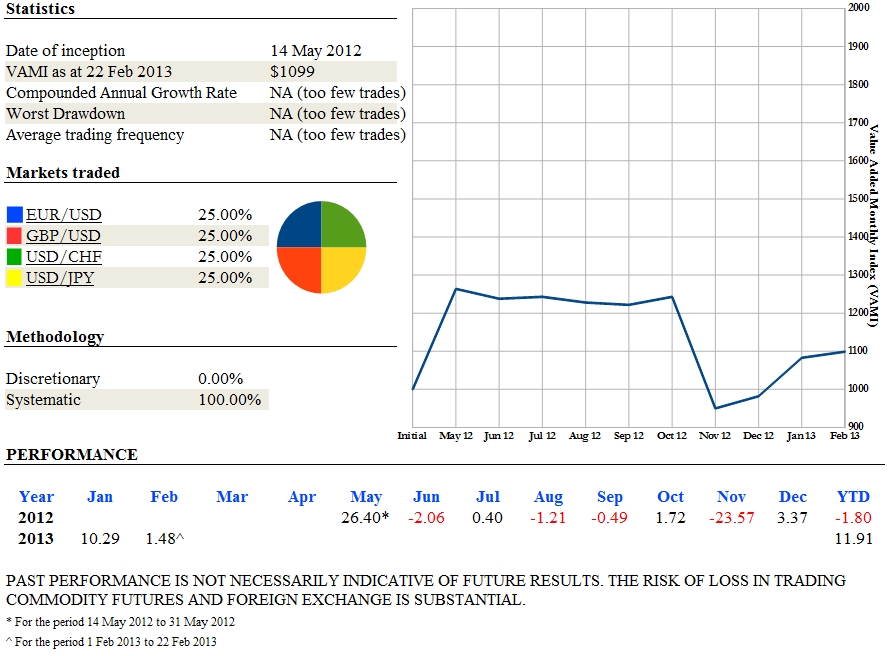
Performance for the period 23 February 2013 to 8 March 2013: +1.82%

Opening VAMI: $1099
Gains/(Losses): $20
Closing VAMI: $1119

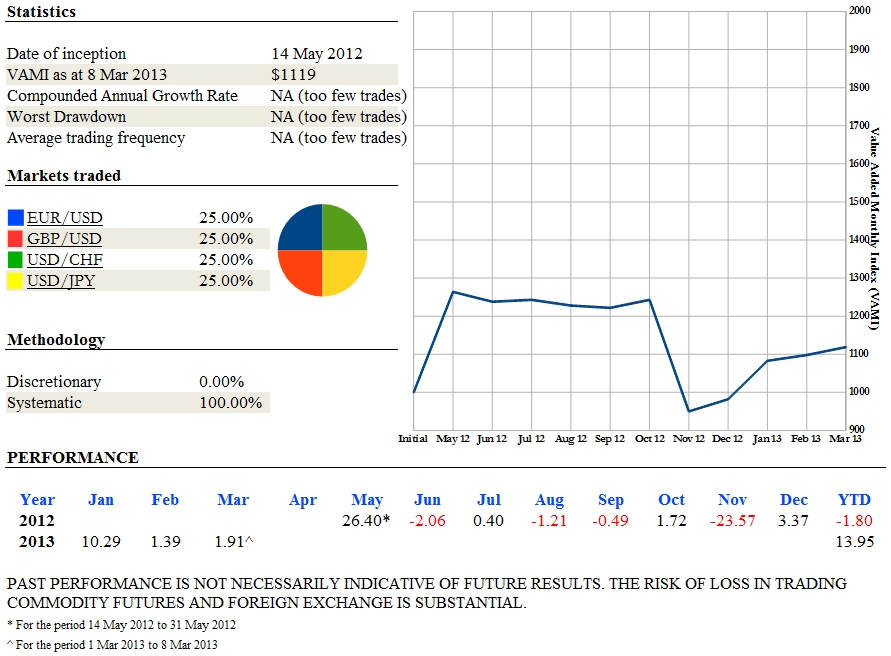
satc-20130308.jpg
 
Performance for the week ended 15 March 2013: <font color="red">-4.38%</font>

Opening VAMI: $1119
Gains/(Losses): <font color="red">($49)</font>
Closing VAMI: $1070

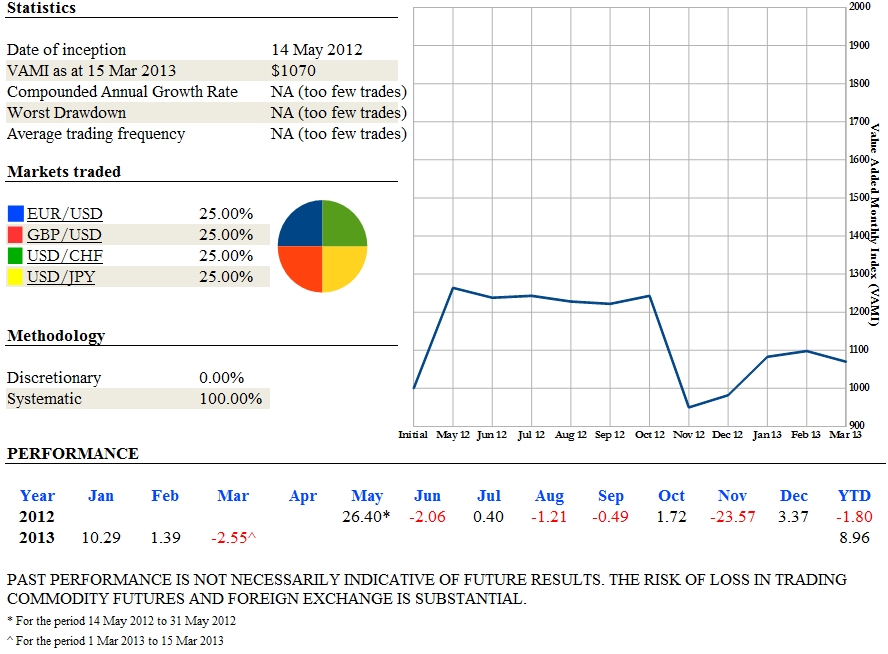
satc-20130315.jpg
 
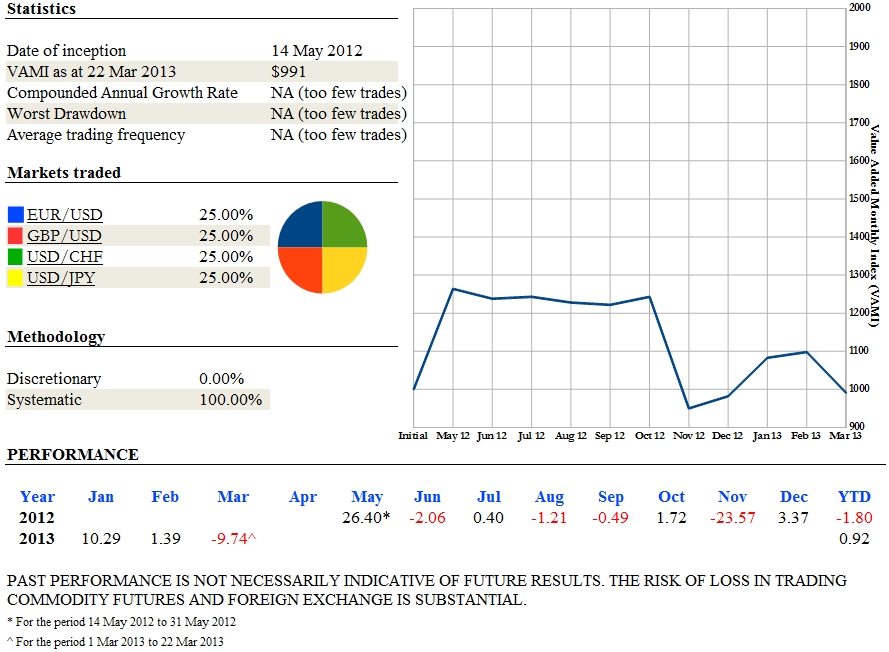
Performance for the week ended 22 March 2013: <font color="red">-7.38%</font>

Opening VAMI: $1070
Gains/(Losses): <font color="red">($79)</font>
Closing VAMI: $991

satc-20130322.jpg
 
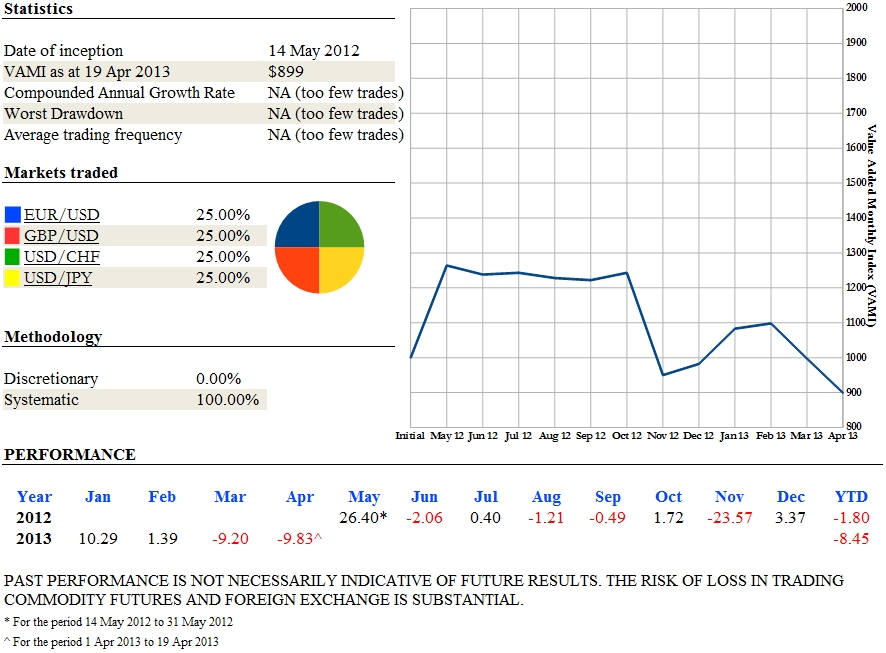
Performance for the period 23 March 2013 to 19 April 2013: <font color="red">-9.28%</font>

Opening VAMI: $991
Gains/(Losses): <font color="red">($92)</font>
Closing VAMI: $899

satc-20130419.jpg
 
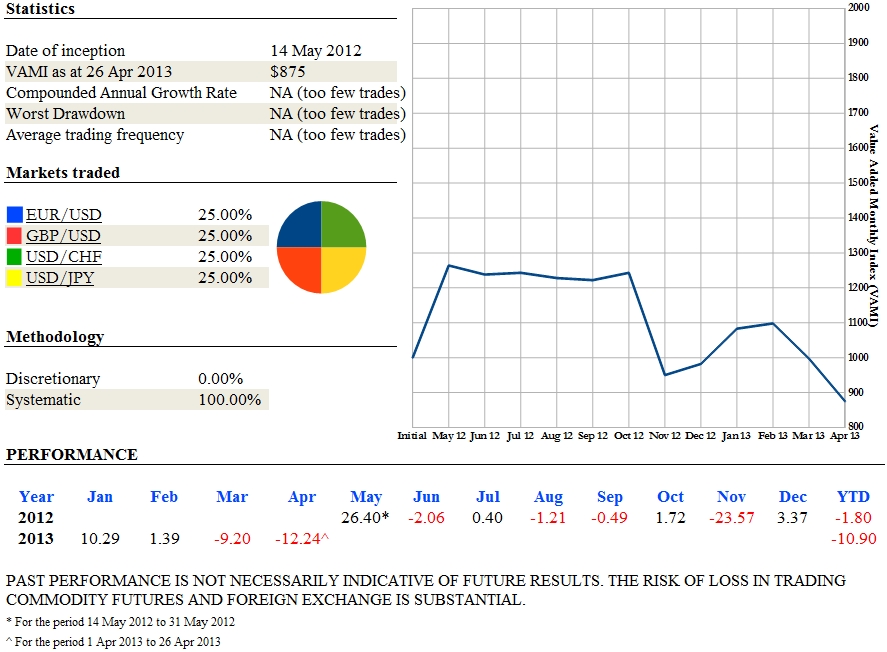
Performance for the week ended 26 April 2013: <font color="red">-2.67%</font>

Opening VAMI: $899
Gains/(Losses): <font color="red">($24)</font>
Closing VAMI: $875

satc-20130426.jpg
 
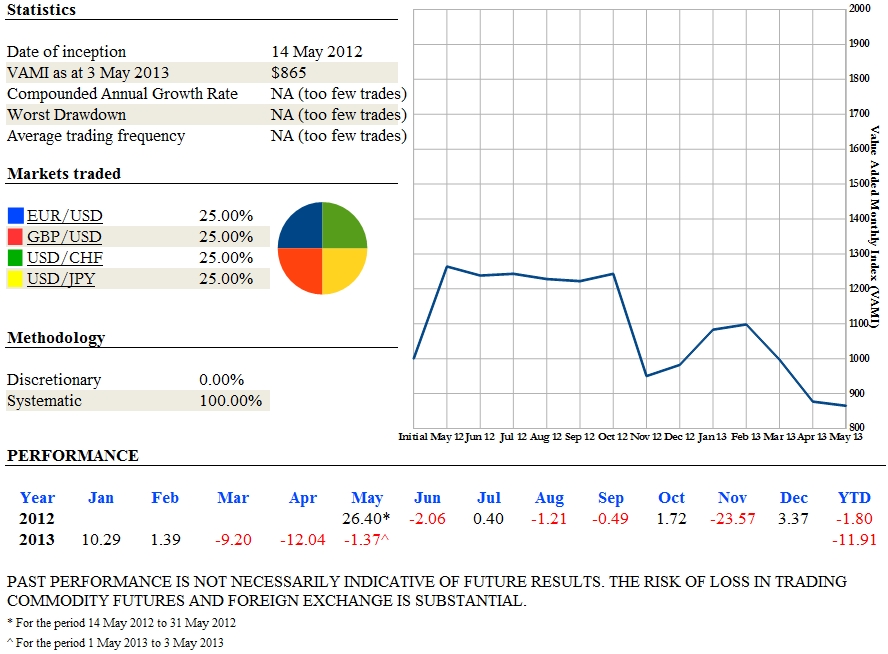
Performance for the week ended 3 May 2013: <font color="red">-1.14%</font>

Opening VAMI: $875
Gains/(Losses): <font color="red">($10)</font>
Closing VAMI: $865

satc-20130503.jpg
 
Back
Top