
You are using an out of date browser. It may not display this or other websites correctly.
You should upgrade or use an alternative browser.
You should upgrade or use an alternative browser.
Building a live account 2 - US$1,000 to more than US$200,000 in 30 years
- Thread starter traderFJ
- Start date
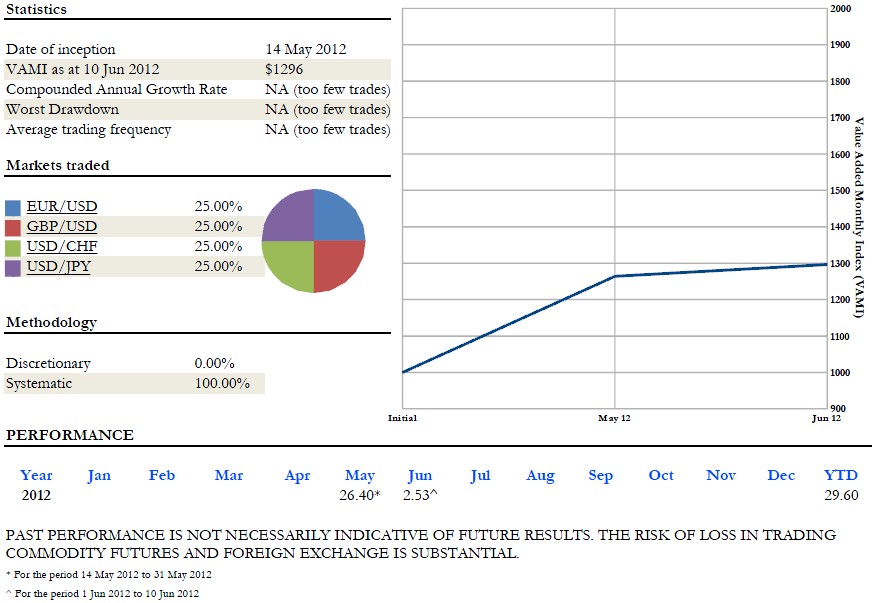



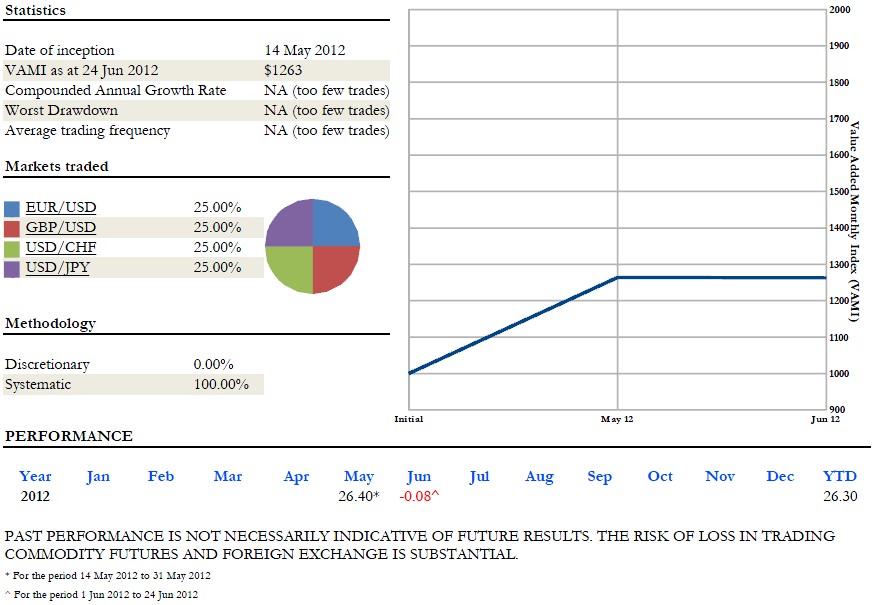

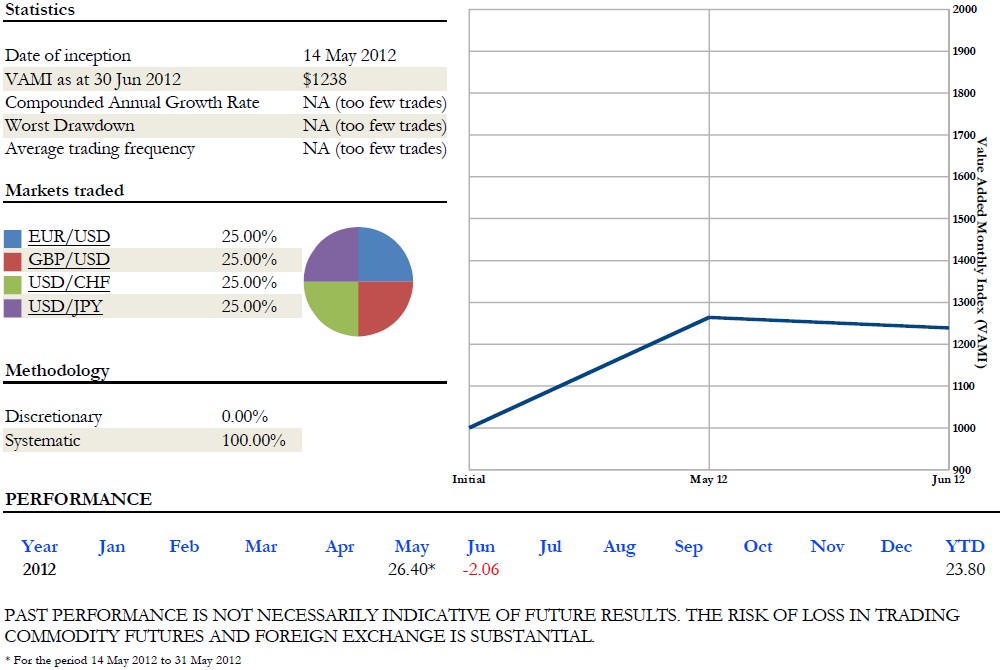

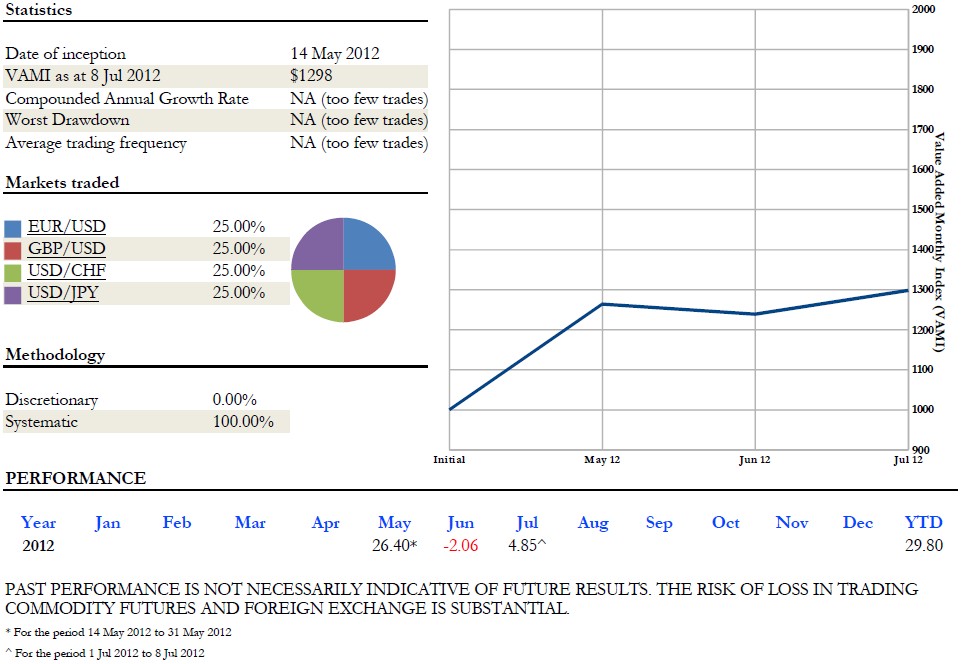

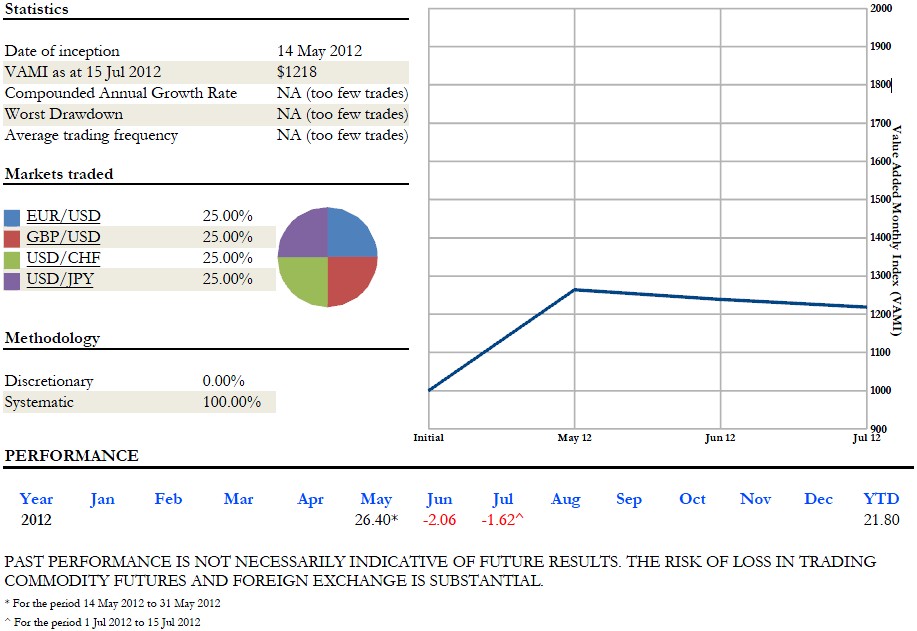

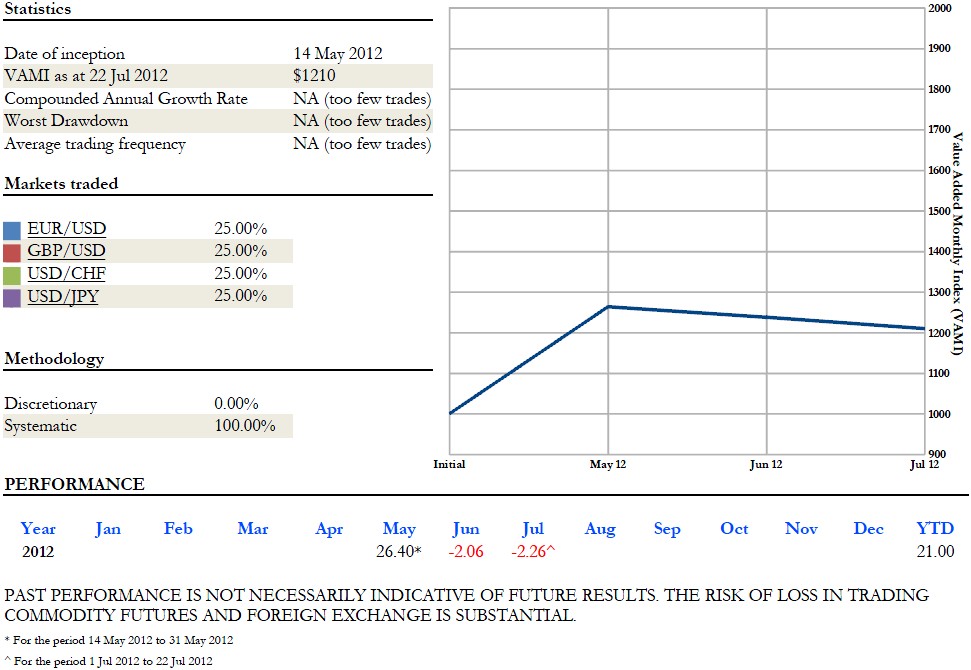

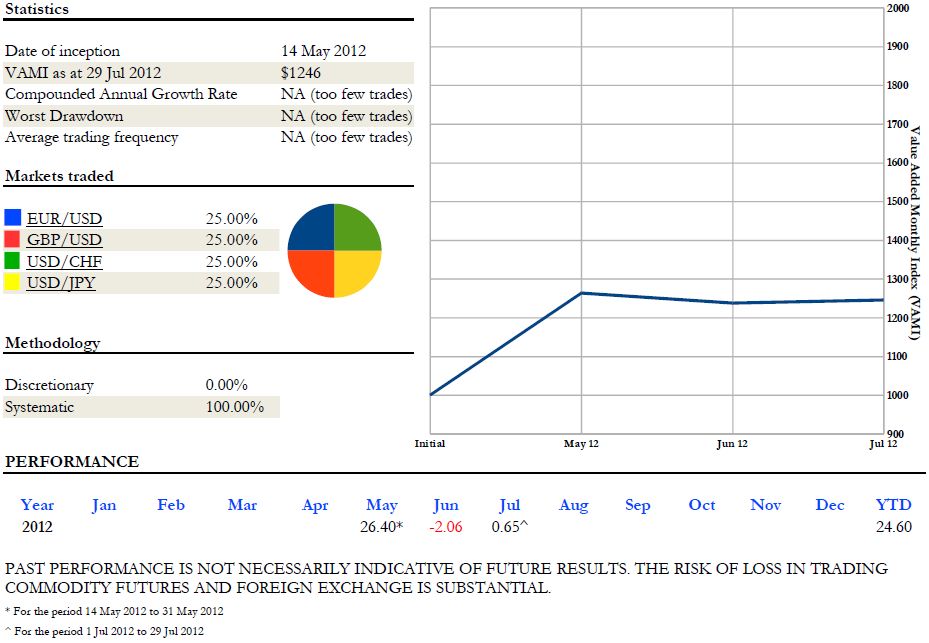
Performance for the week ended 29 July 2012: +3.04%
Opening equity: $1,209.56
Deposits/(Withdrawals): $0
Gains/(Losses): $36.81
Closing equity: $1,246.37
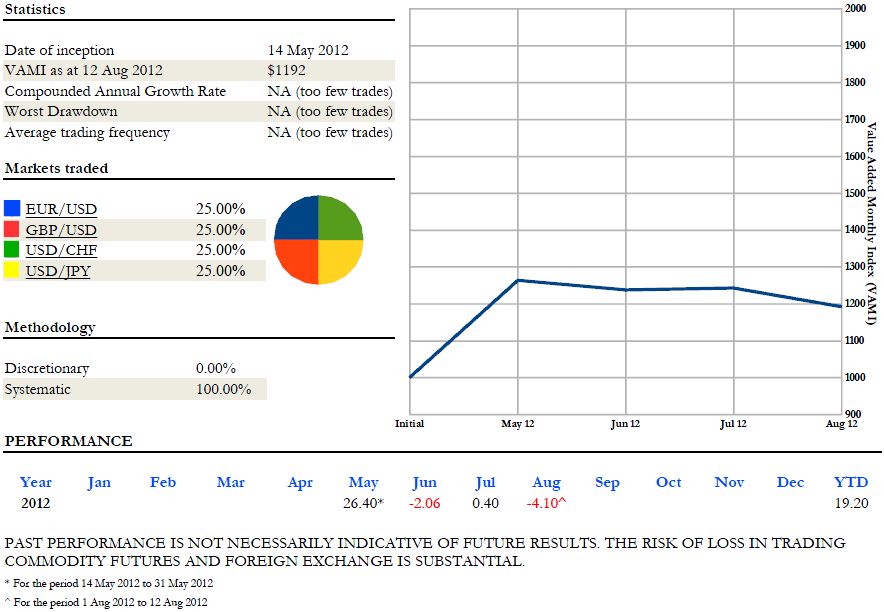
Note: As additional money may be added to the live account from time to time, the measure of success for "Building a live account 2 - $1,000 to more than $200,000 in 30 years" will be the Value Added Monthly Index (âVAMIâ) which tracks the growth of the initial $1,000 deposit.
Opening equity: $1,209.56
Deposits/(Withdrawals): $0
Gains/(Losses): $36.81
Closing equity: $1,246.37
Note: As additional money may be added to the live account from time to time, the measure of success for "Building a live account 2 - $1,000 to more than $200,000 in 30 years" will be the Value Added Monthly Index (âVAMIâ) which tracks the growth of the initial $1,000 deposit.
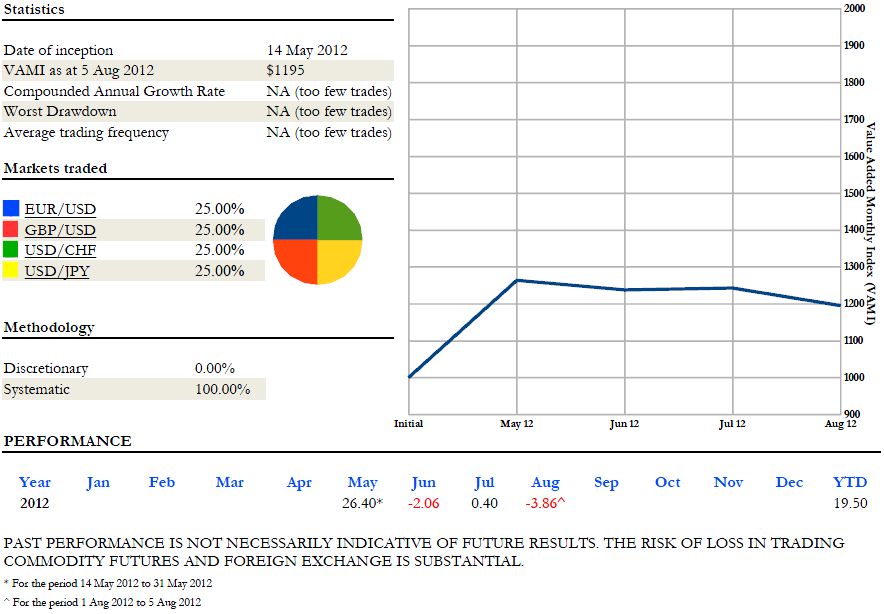
Performance for the week ended 5 August 2012: <font color="red">-4.14%</font>
Opening equity: $1,246.37
Deposits/(Withdrawals): $0
Gains/(Losses): <font color="red">$(51.65)</font>
Closing equity: $1,246.37
Note: As additional money may be added to the live account from time to time, the measure of success for "Building a live account 2 - $1,000 to more than $200,000 in 30 years" will be the Value Added Monthly Index (âVAMIâ) which tracks the growth of the initial $1,000 deposit.
Opening equity: $1,246.37
Deposits/(Withdrawals): $0
Gains/(Losses): <font color="red">$(51.65)</font>
Closing equity: $1,246.37
Note: As additional money may be added to the live account from time to time, the measure of success for "Building a live account 2 - $1,000 to more than $200,000 in 30 years" will be the Value Added Monthly Index (âVAMIâ) which tracks the growth of the initial $1,000 deposit.
Performance for the week ended 12 August 2012: <font color="red">-0.19%</font>
Opening equity: $1,194.72
Deposits/(Withdrawals): $0
Gains/(Losses): <font color="red">$(2.30)</font>
Closing equity: $1,192.42
Note: As additional money may be added to the live account from time to time, the measure of success for "Building a live account 2 - $1,000 to more than $200,000 in 30 years" will be the Value Added Monthly Index (âVAMIâ) which tracks the growth of the initial $1,000 deposit.
Opening equity: $1,194.72
Deposits/(Withdrawals): $0
Gains/(Losses): <font color="red">$(2.30)</font>
Closing equity: $1,192.42
Note: As additional money may be added to the live account from time to time, the measure of success for "Building a live account 2 - $1,000 to more than $200,000 in 30 years" will be the Value Added Monthly Index (âVAMIâ) which tracks the growth of the initial $1,000 deposit.