 Raoul Pal @RaoulGMI 4h4 hours ago
More #oil... the US Dollar Broad Trade Weighted Index is suggesting that oil should be at $30.


You are using an out of date browser. It may not display this or other websites correctly.
You should upgrade or use an alternative browser.
You should upgrade or use an alternative browser.
WTF was this in gasoline?
- Thread starter jj90
- Start date

OtterWood Capital
@OtterWoodCapM
US Drillers Add Most Rigs In Nearly Four Yearsotterwoodcapital.com/blog/us-drille…

SUBSCRIBETOHEDGEYE.
01/23/17 09:11 AM EST
Wall Street Consensus: Oil = Love It ... Bonds = Hate It ... S&P 500 = Meh

Wall Street isn't super bullish on the U.S. stock market. That may shock you. Instead of arguing with the hard data to support it, think of this as an excellent, non-consensus opportunity to get long stocks (as U.S. growth and inflation accelerates).
The evidence is obvious. To get a read on consensus positioning, we analyze the CFTC's data on institutional investor's net futures and options positioning for a variety of asset classes. We then take those numbers and compare them to the average contract positioning over the last twelve months.
What you get is called a Z-score. This is basically a fancy way of saying investors are either bullish or bearish versus their historical average over the last year. A negative reading means consensus is more bearish than past positioning and, conversely, a positive reading means they are more bullish. Pretty simple.
WALL STREET'S TOP-10 LONGS & SHORTS
#Oil #Bonds #Yen
As you can see in theChart of the Daybelow, Wall Street is very short the Japanese Yen and 10-year Treasury bonds. On the long side, consensus likes wheat and crude oil. Our research suggests that when the Z-Score exceeds 2.0 times it generally signals a move is overdone in either direction (i.e. the trade is getting particularly crowded).

HOW DO U.S. EQUITIES STACK UP?
$SPY #Stocks
The Z-Score for the S&P 500 is +0.23 times, meaning institutional investor positioning is in-line with the average over the past year. This is small peanuts compared to positions in the Yen, Wheat or Oil.
In other words, Wall Street could get a lot more bullish on U.S. stocks from here, especially since growth and inflation datacontinue to accelerate heading into the first quarter of 2017 and S&P 500earnings improve.
01/23/17 09:11 AM EST
Wall Street Consensus: Oil = Love It ... Bonds = Hate It ... S&P 500 = Meh

Wall Street isn't super bullish on the U.S. stock market. That may shock you. Instead of arguing with the hard data to support it, think of this as an excellent, non-consensus opportunity to get long stocks (as U.S. growth and inflation accelerates).
The evidence is obvious. To get a read on consensus positioning, we analyze the CFTC's data on institutional investor's net futures and options positioning for a variety of asset classes. We then take those numbers and compare them to the average contract positioning over the last twelve months.
What you get is called a Z-score. This is basically a fancy way of saying investors are either bullish or bearish versus their historical average over the last year. A negative reading means consensus is more bearish than past positioning and, conversely, a positive reading means they are more bullish. Pretty simple.
WALL STREET'S TOP-10 LONGS & SHORTS
#Oil #Bonds #Yen
As you can see in theChart of the Daybelow, Wall Street is very short the Japanese Yen and 10-year Treasury bonds. On the long side, consensus likes wheat and crude oil. Our research suggests that when the Z-Score exceeds 2.0 times it generally signals a move is overdone in either direction (i.e. the trade is getting particularly crowded).

HOW DO U.S. EQUITIES STACK UP?
$SPY #Stocks
The Z-Score for the S&P 500 is +0.23 times, meaning institutional investor positioning is in-line with the average over the past year. This is small peanuts compared to positions in the Yen, Wheat or Oil.
In other words, Wall Street could get a lot more bullish on U.S. stocks from here, especially since growth and inflation datacontinue to accelerate heading into the first quarter of 2017 and S&P 500earnings improve.
Raoul Pal @RaoulGMI
#oil - It if breaks $50, it is likely to test the trend line at $44...Im getting closer to pulling the trigger on a short.
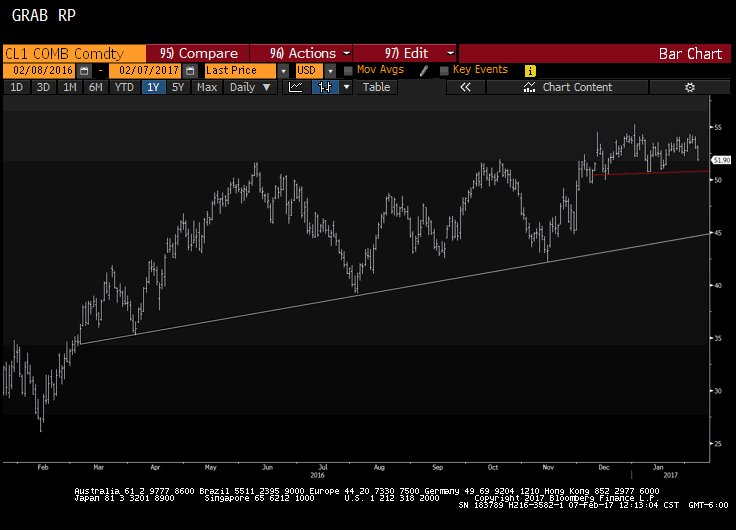
#oil - It if breaks $50, it is likely to test the trend line at $44...Im getting closer to pulling the trigger on a short.
%%SUBSCRIBETOHEDGEYE.
01/23/17 09:11 AM EST
Wall Street Consensus: Oil = Love It ... Bonds = Hate It ... S&P 500 = Meh
Wall Street isn't super bullish on the U.S. stock market. That may shock you. Instead of arguing with the hard data to support it, think of this as an excellent, non-consensus opportunity to get long stocks (as U.S. growth and inflation accelerates).
The evidence is obvious. To get a read on consensus positioning, we analyze the CFTC's data on institutional investor's net futures and options positioning for a variety of asset classes. We then take those numbers and compare them to the average contract positioning over the last twelve months.
What you get is called a Z-score. This is basically a fancy way of saying investors are either bullish or bearish versus their historical average over the last year. A negative reading means consensus is more bearish than past positioning and, conversely, a positive reading means they are more bullish. Pretty simple.
WALL STREET'S TOP-10 LONGS & SHORTS
#Oil #Bonds #Yen
As you can see in theChart of the Daybelow, Wall Street is very short the Japanese Yen and 10-year Treasury bonds. On the long side, consensus likes wheat and crude oil. Our research suggests that when the Z-Score exceeds 2.0 times it generally signals a move is overdone in either direction (i.e. the trade is getting particularly crowded).
HOW DO U.S. EQUITIES STACK UP?
$SPY #Stocks
The Z-Score for the S&P 500 is +0.23 times, meaning institutional investor positioning is in-line with the average over the past year. This is small peanuts compared to positions in the Yen, Wheat or Oil.
In other words, Wall Street could get a lot more bullish on U.S. stocks from here, especially since growth and inflation datacontinue to accelerate heading into the first quarter of 2017 and S&P 500earnings improve.
Good call; they did get a lot more into S&P[SPY.......]
Its'a bull market you know-Old Turkey quote LOL. It also a real extended uptrend on the monthly candle-charts,+ daily candle charts. Bull market can get more extended; but Investors Business Daily doesnt like ignoring that lower buy volume much.
The perenniel lady bull on[AFA radio ] said the reason gasoline has not come down much with CL, is gasoline[supply] is up. NOT that i would trade off that kind of news.LOL
-
 Liz Ann Sonders @LizAnnSonders 4h4 hours ago
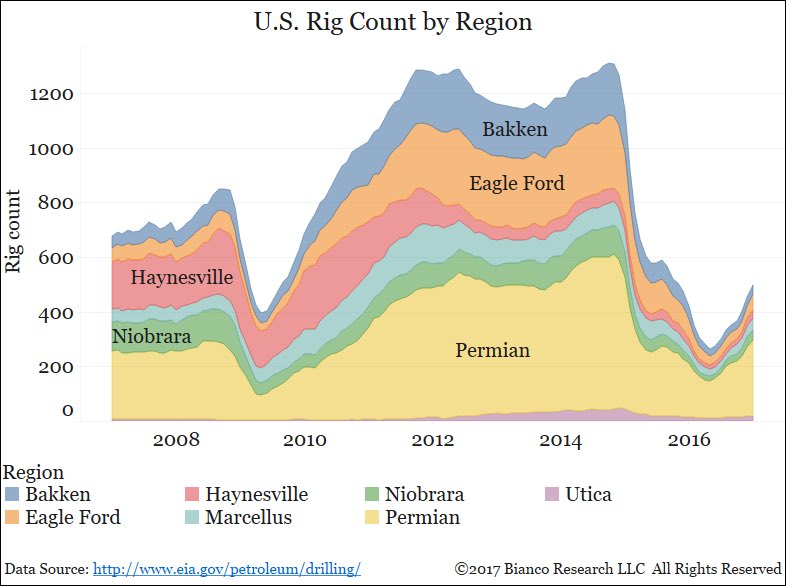
Rig count on the rise again (everywhere) @biancoresearch
Russia overtakes Saudi Arabia as world's top crude producer
http://www.sfgate.com/business/article/Russia-Overtakes-Saudi-Arabia-as-World-s-Largest-10945451.php
http://www.sfgate.com/business/article/Russia-Overtakes-Saudi-Arabia-as-World-s-Largest-10945451.php

Russia overtakes Saudi Arabia as world's top crude producer
http://www.sfgate.com/business/article/Russia-Overtakes-Saudi-Arabia-as-World-s-Largest-10945451.php
Of course Russia has exceeded SA. SA agreed with the rest of most OPEC nations to cut their production. Russia, as a non-OPEC producer, did not cut production. Do the math.
Of course Russia has exceeded SA. SA agreed with the rest of most OPEC nations to cut their production. Russia, as a non-OPEC producer, did not cut production. Do the math.
OPEC members are infamous for cheating on their quotas.....
Last edited: