yesWhat are "KR's levels"?
Key Reversal?
You are using an out of date browser. It may not display this or other websites correctly.
You should upgrade or use an alternative browser.
You should upgrade or use an alternative browser.
Why Is The Obvious Not So Obvious?
- Thread starter nysestocks
- Start date
skip the hieroglyphsWell; reading his old posts is difficult enough...
Is it my browser or do others get hieroglyphs a well?
"Aside â I can no more change you â than you can change me Sir."
well to me it all linear, a chartI'm just pondering over the WHEN...; isn't that another key?
in other words the when always coincides with the where , so again just IMHO irrelevant but will be happy to be shown by someone a lot smarter than I that i don't know what i don't knowI'm just pondering over the WHEN...; isn't that another key?
Nice thread. I've watched a few folk over the years dangle carrots about how "obvious" or "easy" it is....."once you see it you can't unsee it". But 800 pages and 13 years later...it doesn't look like too many people saw what nysestocks saw.
I remember round about the same time there was a guy CrucialPoint (think it was on FF) with very similar theories...and again quite a lot of riddles and puzzles...lol...wonder if it was the same person? The writing style seemed quite different mind you....and it was nothing to do with NYSE stocks... but it gave the impression that all charts dance to the same beat...forex, indices, commodities, stocks. And really...little importance was given to the history of the chart.. just trading in the now, in the current candle, in whatever TF that may be. It caught my attention at the time because all my trading was based on looking left.
So what is the "obvious"? I've heard people say candles have no place in trading, they just package price into a time interval. An H1 candle can "hide" a lot of information from a daytrader. It can look like a solid move up or down but you can't "see" the price action when it takes out a former high or low.
Both NS and CP mention OHLC a lot so it's important. What info can we gather from that? Well, an ADR/ATR for one. If we are daytrading we could use hourly ATR as a guide for how much our current candle could move. With price moving fractally, we could also check today's Daily candle movement in relation to the average Daily movement lately. Would there still be enough movement left in our daily range to allow our H1 move to play out? From OHLC we can always work out a midpoint too. Long bias when price is above yesterday's midpoint? What about today? The midpoint varies as the day's range expands. Still the same principle? Longs above current midpoint and yesterday's midpoint. Price often does measured moves... can these be more accurately measured given the data within OHLC?
Onto the BLSH 90%/10% thing. I've only read the first 40 pages or so of the thread. Was it nysestocks preferred method to fade breakouts. It does make sense...stoplosses lie above recent highs and lows and you need fuel before you can start a journey anywhere, right? There will always be the "fear" that price just continues past a high or low after BO..but should that be a reason to discard these trades? .........
What if the average swing in your timeframe is 150 pips ?
What if the average break of a recent high or low is 20 pips in that timeframe?
What if there was a very high chance that after breaking that recent high/low price would at LEAST return to the point of breakout?....is that the "obvious"?
What if we opened 2 trades near the 20 pip breakout limit...TP on one as we retrace to the BO point and let the other run to the other end of that 150 pip swing..or if it bounces and decides to go in the direction of the BO then we cut just past entry point. Sure..if price just keeps going past the 20 pip average stoploss and there is no retrace then we lose on the 2 trades...but that level can be calculated too and kept quite tight.
Sometimes you look at a chart and say "look...that H1 candle just flew through the H/L without pausing for a second". That can be the timeframe illusion. Go down to M1 and you'll very often see that break and retrace that is hidden in H1. Of couse..at NFP or FED decisions price can just blow straight thru. But who is playing on the field at these moment? Is it just intraday scalpers or are the big boys looking for big moves? If they are looking at H4 targets then it makes sense to step aside and not play 20 pip breakout retraces when they might be looking at knocking out larger swing players (eg, 500 point swing with 100 point stoplosses).
Anyway...enough of my mad ramblings at the moment. Just thought I'd add my thought to a great thread .
Nice post. Interesting how fast it was buried under not very useful comments, after some good time of silence in the thread.
About nysestocks, the guy called “the expert” sounds like him for me:
https://www.trade2win.com/threads/how-to-trade-full-stop.87916/
I stumbled upon other instances of him here in this very thread and in other places.
well to me it all linear, a chart
I can see looking back through this thread that you had a big a-ha moment in it. I haven't found the redneck post you mentioned yet. It's such a shame all the early charts are no longer there to learn from.
"Great post, WRB and NRB and KR's levels of real significance" "well to me it all linear"... hmm, I'm having trouble understanding how these 2 quotes fit together. "all linear" to me suggests that price moves up and down and whether it's in m1, m5, daily or monthly candles it really doesn't matter..it's all just one big candle? The packaging of time within a candle isn't important? But then...how would we have WRBs and NRBs to trade off if we don't define these candles within a set timeframe? A WRB 5min candle looks completely different in m1 candles. A WRB 5min candle is completely hidden in an H1 candle....or am I completely overthinking this and you just mean WRB NRB daily candles?
I'd love to learn more from this thread so any scraps you could throw me to work on would be most appreciated.
Regards
RR
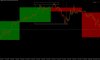
GBP/JPY 8/9th of June isn't a bad example
And seeing as you left this post, I should at least make an effort to understand it. I see the days you mention are a WRB followed by a NRB. On the 9th it runs the stops of the 8th high and low (white boxes). On the 10th it takes the stops below the low of the 9th. It keeps going down, but there is that retrace I talked about on my first post that would allow a trader with say 2 positions to clear that traded without and damage done. I know I'm missing more "obvious" stuff..but I just can't "see" it yet
Attachments
baron193 - "I do use fibs, not because of the "magic" numbers but because it is a great tool to display the previous days high and low and also for another reason which i shall not reveal."
Hmm..interesting. I'm not a big believer on actual fib numbers either.. Yeah, sometimes they work...but is that deliberate price bouncing just to keep folk interested in the whole magic fib number phenomenon?
Ok,,the obvious way to use the fib tool if not using actual fib numbers would be to show the midpoint of yesterdays range (50% of H-L). I know price often bounces from here on first touch the following day..but it's not a given. I guess you could also mark the precentages of yesterdays range too...25,50,75 and maybe more maths friendly extensions like +/- 25%,50%,75%,100% ?
View attachment 287780
oops..chart fibs wrong on chart above..can't edit post so reposting chart...
