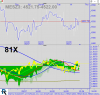
For me, the most important thing about using a rate of change indicator is it's relationship with other differing rate of change indicators, ie ones that are created from different periodicities and/or different smoothing levels. To do this effectively you have to have a charting program that can create custom indicators (most can) as well as embed indicators in the same chart of different periodicities than the native periodicity of the chart.
Overlaying these is the first step to creating a signal because crossing over of similar roc indicators indicates deceleration, which for the smoothed indicators is one of the important components to recognize for a reversal setup. A raw rate of change indicator that moves much more dynamically with the underlying price also needs to be added in order to compare the relationship of the smoothed rate of change with the raw (erratic) rate of change. These relationships (which each indicator will either be positive or negative, and moving up or down, and moving towards each other or away, are very important to evaluate together to learn the many common patterns and relationships of how volatility moves over time (particularly when using multiple periodicities simultaneously.)
No doubt this sounds pretty alien at this point because this is just one person's approach developed over many years, but you asked so I wanted to give some insight into a direction of analysis that I think is very important but commonly overlooked.