What is your way of identifying trend reversals?

They all work if you curve-fit/parameter-fit (at least for me). But all mine failed, or had meager profits, in real time.

Indicators are all lagging, they just extrapolate the past.

Great that your indicator using group delay works for you. Congratulations!
no one can analyse the future ........only the past can be analysed.
we either extrapolate the past.......or assume that the past will not continue.
this is why no prediction-of anything- can be correct all the time
 
Your faking the "not understanding the English language and how to have a conversation" doesn't fly here.

"....but i am man enough to admit it"

I then responded you did not admit to anything. I didn't suggest you SHOULD admit to anything. I am simply calling out that you did not admit to anything. How hard is this for you to understand? Sorry, I can't type Hindi to make it more clear to you.

What was your entry and exit on your perfect short trade? Can you at least understand and answer that?
sure look up Brooks books
et4.png
 
Rate of change indicators are excellent for identifying reversal opportunities as a function of time respective to the data periodicities analyzed. It's very complicated to do correctly and thoroughly, but it's the only process of analysis I've ever used.
 
Last edited:
Rate of change indicators are excellent for identifying reversal opportunities as a function of time respective to the data periodicities analyzed. It's very complicated to do correctly and thoroughly, but it's the only process of analysis I've ever used.
:thumbsup:
My fav of all time - ROC of (Close/Close[10]).

No averaging, just price change currently versus the past.
 
Rate of change indicators are excellent for identifying reversal opportunities as a function of time respective to the data periodicities analyzed. It's very complicated to do correctly and thoroughly, but it's the only process of analysis I've ever used.
I agree with you. First and second derivatives do work but I find it difficult to generate especially in real time. Do you have any suggestions for me?

Thanks.
 
For me, the most important thing about using a rate of change indicator is it's relationship with other differing rate of change indicators, ie ones that are created from different periodicities and/or different smoothing levels. To do this effectively you have to have a charting program that can create custom indicators (most can) as well as embed indicators in the same chart of different periodicities than the native periodicity of the chart.

Overlaying these is the first step to creating a signal because crossing over of similar roc indicators indicates deceleration, which for the smoothed indicators is one of the important components to recognize for a reversal setup. A raw rate of change indicator that moves much more dynamically with the underlying price also needs to be added in order to compare the relationship of the smoothed rate of change with the raw (erratic) rate of change. These relationships (which each indicator will either be positive or negative, and moving up or down, and moving towards each other or away, are very important to evaluate together to learn the many common patterns and relationships of how volatility moves over time (particularly when using multiple periodicities simultaneously.)

No doubt this sounds pretty alien at this point because this is just one person's approach developed over many years, but you asked so I wanted to give some insight into a direction of analysis that I think is very important but commonly overlooked.

 
For me, the most important thing about using a rate of change indicator is it's relationship with other differing rate of change indicators, ie ones that are created from different periodicities and/or different smoothing levels. To do this effectively you have to have a charting program that can create custom indicators (most can) as well as embed indicators in the same chart of different periodicities than the native periodicity of the chart.

Overlaying these is the first step to creating a signal because crossing over of similar roc indicators indicates deceleration, which for the smoothed indicators is one of the important components to recognize for a reversal setup. A raw rate of change indicator that moves much more dynamically with the underlying price also needs to be added in order to compare the relationship of the smoothed rate of change with the raw (erratic) rate of change. These relationships (which each indicator will either be positive or negative, and moving up or down, and moving towards each other or away, are very important to evaluate together to learn the many common patterns and relationships of how volatility moves over time (particularly when using multiple periodicities simultaneously.)

No doubt this sounds pretty alien at this point because this is just one person's approach developed over many years, but you asked so I wanted to give some insight into a direction of analysis that I think is very important but commonly overlooked.
Appreciate your reply. I am sure like me you have been at it a long time.

I also tried to find ways to compute first and second derivatives, went as far as a polynomial least square fit, then compute the first and second derivative. Very cumbersome, OK for backtest but not amenable for real time trade.

Anyway I found my best estimate is actually my eyeball.

Best regards,
 
I agree with you. First and second derivatives do work but I find it difficult to generate especially in real time. Do you have any suggestions for me?

Thanks.

Yes, a long time, like write trades on paper tickets and submit them to clearing house days. The problem imo with calculating derivatives and using those values is that you have to smooth the data first, correct? And anytime you smooth the data, you have lag between that and the realtime price movement that could at times be significantly different, sometimes relevant and sometimes not, and incorporating that relationship. Another problem is that imo all time frames are important, just that some are relevant for reversals at certain times but not others, and the one or ones that are chosen will go in and out of relevancy (at least how I'm thinking of it.) So I don't calculate them to view, I just use others to predict where their oscillations will reverse.

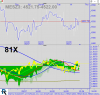
Here is a chart that reflects a portion of the approach. For example the yellow is raw shortterm and when it is inside a smoothed oscillation like light green (higher than it when light green is negative, lower it when light green is positive), the green will restrict how far yellow can go and determine when the futures will reverse if they go that far.

There is a lot going on here that would take a long time to explain, but you might be able to figure some things out by just looking at it, including how crossovers of the smoothed indicators can affect predictions. Rate of change is imo not just a calculation of movement over time, but actually a driver of volatility in very complex ways that creates and constrains it at different times.
 

Attachments

  • rate_of_change_aisone.png
    rate_of_change_aisone.png
    37.8 KB · Views: 17
Last edited:
Hello padutrader,

What is your plan for exiting the trade?
i have understood what brooks says by saying 'bar by bar'........i have my stop in place but i watch the price action 'bar by bar' for any weakness in the ongoing move to exit.
so no plans.
but that does not mean that i am not cognizant of the important fact that we enter only to exit at some later time......i am not Warren Buffet
 
Back
Top