https://wattsupwiththat.com/2016/07...lower-troposphere-temperature-anomaly-update/
.....
As noted above, the models in this post are represented by the CMIP5 multi-model mean (historic through 2005 and RCP8.5 forcings afterwards), which are the climate models used by the IPCC for their 5th Assessment Report.
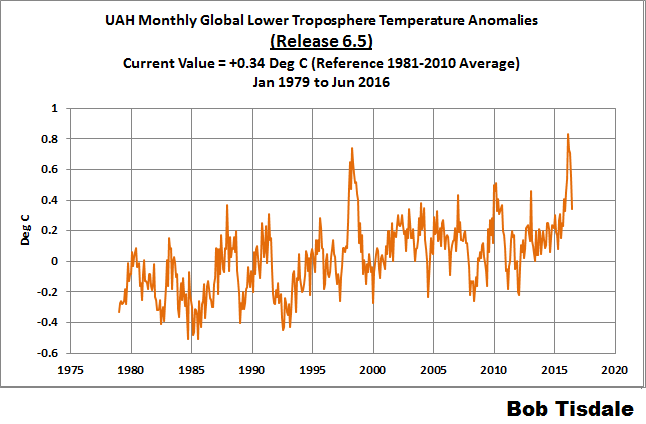
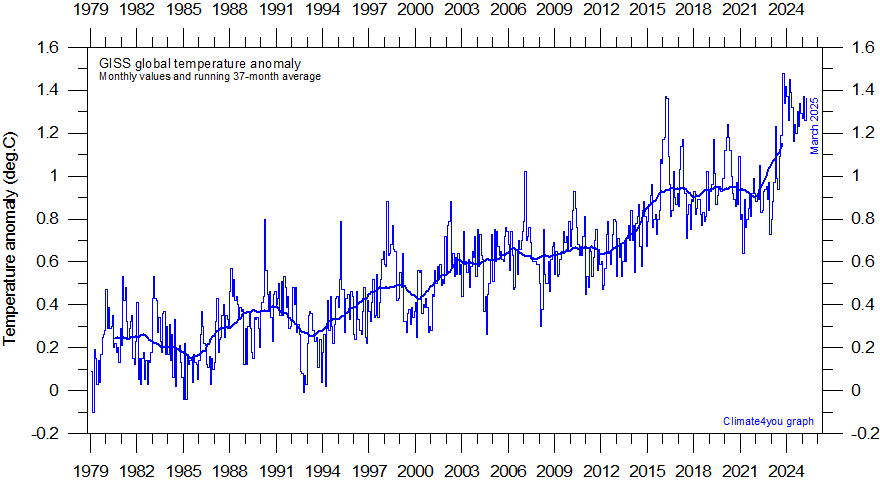
Considering the uptick in surface temperatures in 2014, 2015 and now 2016 (see the posts
here and
here), government agencies that supply global surface temperature products have been touting “record high” combined global land and ocean surface temperatures. Alarmists happily ignore the fact that it is easy to have record high global temperatures in the midst of a hiatus or slowdown in global warming, and they have been using the recent record highs to draw attention away from the growing difference between observed global surface temperatures and the IPCC climate model-based projections of them.
There are a number of ways to present how poorly climate models simulate global surface temperatures. Normally they are compared in a time-series graph. See the example in Figure 10. In that example, the UKMO HadCRUT4 land+ocean surface temperature reconstruction is compared to the multi-model mean of the climate models stored in the CMIP5 archive, which was used by the IPCC for their 5th Assessment Report. The reconstruction and model outputs have been smoothed with 61-month running-mean filters to reduce the monthly variations. The climate science community commonly uses a 5-year running-mean filter (basically the same as a 61-month filter) to minimize the impacts of El Niño and La Niña events, as shown on the GISS webpage
here. Using a 5-year running mean filter has been commonplace in global temperature-related studies for decades. (See Figure 13
here from Hansen and Lebedeff 1987
Global Trends of Measured Surface Air Temperature.) Also, the anomalies for the reconstruction and model outputs have been referenced to the period of 1880 to 2013 so not to bias the r