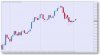
On May 17th I wrote something about two particular trade setups likely being my “bread and butter” moving forward. However, I’m no longer thinking in those terms. Though it might be that I still watch for the exact same two scenarios, if true, I’m now doing it with the idea that what I need to see is the various components of the system relating and interacting with one another in accordance with a specific set of parameters.
I’m no longer inclined to comment on my intraday trading due to the fact that: (1) the chances that I will be modifying any of the settings I’ve settled on after two years of experimentation are slim to none; (2) the process of day trading using Numerical Price Prediction is extremely fluid and dynamic, so my time is better spent monitoring and reacting to the market as opposed to commenting about it; and (3) I don’t anticipate there being many, if any, new revelations or insights stemming from my guerrilla trading activity.
With my settings pretty much finalized and my approach to intraday trading having essentially become routine, I now plan to turn my attention to using the Numerical Price Prediction system to capitalize on major trend reversals to realize 20 to 100 pips or more of profit per a single trade as often as possible, if I can.
In doing so, I’m going to refer to a bullish sentiment on my daily charts as a “blue string” and a bearish sentiment as a “red string” with the intention of looking into how often entering a long position following the formation of a red daily candlestick during a blue string, and entering a short position following the formation of a blue daily candlestick during a red string, lead to successful outcomes.
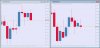
On Friday AUDUSD and NZDUSD both formed red candlesticks during a blue string, so I will be curious to see if their rates head higher from Friday’s close at the start of this new week.
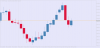
According to my forecast model, AUDJPY was nicely position to swing north at 82.88 if it had wanted, but it decided it would rather continue south instead. At 110.45 CHFJPY is presently saying that it wants to swing higher, so let’s see if it actually does so.
I’m no longer inclined to comment on my intraday trading due to the fact that: (1) the chances that I will be modifying any of the settings I’ve settled on after two years of experimentation are slim to none; (2) the process of day trading using Numerical Price Prediction is extremely fluid and dynamic, so my time is better spent monitoring and reacting to the market as opposed to commenting about it; and (3) I don’t anticipate there being many, if any, new revelations or insights stemming from my guerrilla trading activity.
With my settings pretty much finalized and my approach to intraday trading having essentially become routine, I now plan to turn my attention to using the Numerical Price Prediction system to capitalize on major trend reversals to realize 20 to 100 pips or more of profit per a single trade as often as possible, if I can.
In doing so, I’m going to refer to a bullish sentiment on my daily charts as a “blue string” and a bearish sentiment as a “red string” with the intention of looking into how often entering a long position following the formation of a red daily candlestick during a blue string, and entering a short position following the formation of a blue daily candlestick during a red string, lead to successful outcomes.
On Friday AUDUSD and NZDUSD both formed red candlesticks during a blue string, so I will be curious to see if their rates head higher from Friday’s close at the start of this new week.
According to my forecast model, AUDJPY was nicely position to swing north at 82.88 if it had wanted, but it decided it would rather continue south instead. At 110.45 CHFJPY is presently saying that it wants to swing higher, so let’s see if it actually does so.