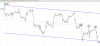
Trading Price:Phase Two:Backtesting

I'm confused by this statement. You had previous to the open posted a down sloping channel within the daily chart. If you bring this channel forward to an hourly chart you get what I've posted. Do you need more here than to notice the rejections on the median of the channel?

You have seven lines, none of which trace the hinge.
 
I've re-read your posts a few times and I'm still confused about what tell it is we are backtesting? You mention that a trendline drawn across the higher lows and the rejection there may be a tell (assuming this is a side note for those interested). Is the tell we are interested in the break of the bottom of the hinge followed by the retest at 15:00?

"We" aren't backtesting anything. I'm just pointing out an interesting feature, the sort of thing that might make an worthwhile avenue of inquiry, which is what backtesting is all about. I hope you guys will find other such features to backtest.
 
You have seven lines, none of which trace the hinge.

I'm probably being thick. You said you couldn't come up with anything that made foresight sense in terms of trend. Yet we already had drawn a down sloping trend channel in foresight. The median of this was all one needed to note overhead resistance.

Hinges seem like a hard behavior to backtest because when they resolve then tend to become obscured. At least to my eye. I'm still confused about what feature you are pointing out - the hinge that was missed on the hourly?

hour2.png
 
Last edited by a moderator:
In this respect, not really. Price behavior, yes. The whatever this is, no.

But thanks.

Figured as much. Here is the price-only version if that's what's more suited for the discussion.

Best of luck with your thread.

[3-27] NQ Trend Simple.png
 
Last edited by a moderator:
Today provided just the sort of environment that requires backtesting. Without it, one can draw all the wrong conclusions about what he ought to be doing next time due to what he thinks he should have done today.

We had discussed at length the overnite activity on the 1st that had a mean of 57. We discussed the opening range yesterday that had a mean of 57. We discussed the overnite range last nite and this morning that had a mean of 57. Therefore, it was reasonable to assume that 57 had some importance.

So then we opened today, and the mean of the opening range was . . . let's not always see the same hands. We then broke above the opening high and reached 68. This fell back and rebounded exactly at the 50% level of the upmove, suggesting strength, then made an attempt at a higher high, which failed. So, is it strength or weakness? Do we short the double top? Or do we wait to go long at a potential third attempt at a higher high? If we do short the supposed double top, do we want to short back into the range? Is this okay given that we are butt up against the upper limit of a major trend channel? Looking back, sure. But where is that short going to be taken?

So let's say we don't, that we wait for a better signal for a short, and we end up in a sideways congestion in the middle of all this at 1005. This is still holding above the 50% level. Do we want to short that? Where?

Then we begin to drop to 54, reaching it at 1019. Is this a double bottom? Do we want to buy this even though it would send us back into the range? Or do we want to wait and see if price falls out of this and resumes its downmove? If we had gone long, we would have been stopped out in a few minutes, which leaves the option of a short after price breaks below. But that trade, if we hung onto it, would have spent the next hour going nowhere.

And so on.

Point is, you can't just look at a chart in hindsight and think Boy, I should have gone short there and just held on; I could have made so many points. It doesn't work that way. Each moment is unique and you never know what's going to happen next. That's why you need a thoroughly-tested plan and to think in terms of probabilities and risk. Otherwise, the market will kick you around like a soccer ball.

All of these elements can be backtested via hindsight charts for probability and risk. What survives can then be forwardtested via replay. What survives that can be simtraded. Shortcutting through all that and going with your "feelings" is not a recipe for success.

 
dbphoenix} Shortcutting through all that and going with your "feelings" is not a recipe for success.[/QUOTE said:
Can you have a case of seeing a legitimate entry based on SLA but not taking it because the behavior, maybe watching the jittery motion of the right tick, maybe some other fact about the chart, tells you that you don't take this entry right now even though it appears as if the entry is valid?

Perhaps its the way price bounced off a level that can tell you this is more likely a reversal versus a small retracement?

The move down today after everyone was gone looked like it could have bottomed out, but then continued, then paused, and continued. Then the move down goes steeper.

How is having a "feeling" different from seeing a legitimate behavior of price that you can use to sway you one way or the other? Or is this possible?
 
Can you have a case of seeing a legitimate entry based on SLA but not taking it because the behavior, maybe watching the jittery motion of the right tick, maybe some other fact about the chart, tells you that you don't take this entry right now even though it appears as if the entry is valid?

Perhaps its the way price bounced off a level that can tell you this is more likely a reversal versus a small retracement?

The move down today after everyone was gone looked like it could have bottomed out, but then continued, then paused, and continued. Then the move down goes steeper.

How is having a "feeling" different from seeing a legitimate behavior of price that you can use to sway you one way or the other? Or is this possible?

That's the sort of question that backtesting is designed to answer.
 
That's the sort of question that backtesting is designed to answer.

Drats. I guess I was thinking more along the lines of the right tick, which is something that cannot be seen in an EOD hindsight chart. Like if price hits the low of a bar many times within the minute, trying to break lower, versus only once which you couldn't see if you don't see the bar form. Was just seeing if there could be a distinction between having a "feeling" which would be illegitimate versus seeing tick behavior which might be acceptable.

Looking forward to getting up early tomorrow!
 
Back
Top