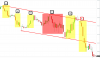
A - So here we have the 5 min SL.
B - Here is the 5 min DL.
C - Break above, waiting for the RET. I mark in a long, wouldn't trigger.
D - This long here isn't a BOPB, since there was no break, but its something else I see, a bounce off the 5 min trendline. Here if price comes up to trigger the entry, I think its a high probability trade to keep rising, which it does in this case.
Of course the trouble is here that we already rejected going above the SL, but if this ends up forming a channel, it is sufficiently wide enough to trade to at least test the highs at C. (This means our SL isn't going to be a problem anymore for price breaking above again)
This is obviously forming a channel now that I think could almost be played..... by someone with a trading plan for channels!
")
E - Break out the bottom. I mark 3 shorts, tracking them up. The trouble is that they go back above the DL, and even close above. The third one would fill and provide a nice move down though.
After this, we have a nice trading range form.
F - Bit of a FBO here.
G - An even tinier one. As long as my entry was below the low of the bar I indicate, it wouldn't trigger until price came back down from the FBO. Does an FBO even strengthen the chance to ride to the bottom of the range again since we ran out of buyers, or shall we be cautious and think that traders are ready to break out the top???
The trouble with this trade, just for my mental jitters, is that it comes up again, twice, before ultimately hitting the bottom of the range again. As long as my new stop was above that FBO, I'd be ok, but this is an entry of about 21 and a stop of 26. I guess the target is down around 13, so this works if my success rate is over 50%, but I'd have to walk away for 20 mins as bh_prop suggested!
H - Using this swing high that comes off a 5 min chart for a SL.
I - We appear to break out the bottom again, but I am now more inclined to use the lows at F for the new range bottom.
J - Bottom is here, and this is also a little FBO from the micro range.
K - Another range here with a FBO. Now this is consolidation above the bottom at J, so we might start looking for a long confirmation.
L - FBO from the range.
M - Exit of range and break of SL.
N - I see the test back down to the SL break (it over shoots it though), and also overshoots a test of the range BO. But if price comes all the way back up above this bar, it would be a series rejection of the low of that bar.
This is exactly what happens. Trouble is that the low of the bar is 14, and with an entry around 20, that is 6 points. The swing high at P is only at 24, so if I go long at 20, I need this to really break out and for this to be a serious up trend. I guess I can always get out in time if we make it to 24 and turn back down, but a stop of 6 points is still quite a bit.
I'm still confused about where stops should be. Sometimes its the low of a previous bar, perhaps a tick lower. Sometimes the stop is a test of where the break of the trendline happened, sometimes I think it could even be a test of the trendline itself which might be even lower than the break if the trendline was a SL and hence slopping down, and sometimes the stop is the low of a range of a previous swing low. No wonder I'm confused... I've got too many setups in my head and I just keep borrowing different ideas from different trades without have a precise set of rules for each! I'm not playing Mr. Potato head here and hence cannot be sticking on random body parts at my leisure!
Q - It is a good rally up from here.
SUMMARY
Shit, if only I could trade as well as I post-analyze. Many of my plotted potential trades are in real time, not just hindsight, so I do have enough in my brain to make this work. Its just far easier with no money being on the line to do the right thing and not care about when it doesn't work out. (My brain bias might also have me remember when it works and not when it doesn't... hence why careful backtesting where each trade setup is taken and the result plotted, regardless of outcome, is essential.)
")