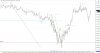
So this chart is a bit busy, but let me explain.
A - This is how my first SL looks.. drawn from the top at 23:06, connecting down to this swing high here. Its just a bit lower than the earlier once, hence the line is quite shallow.
B - Below here is another swing high used for a slightly steeper SL going into the open. There is also a blue line here which will track 50% of this down move.. but more on that later.
C - Here is a swing low I used for a DL going into the open. Its essentially straight, more of horizontal support.
D - By the time we get to here, this SL has been providing a nice trend down. I don't like it when price hugs the trendline going into the open too much because with price being so close, there is no way to really test it... it breaks too easily. If traders want to test a level first, they should have to work for it by either dropping or raising price a few points, not just ticks. These tests to the 5 min trendline do happen often enough that they need to be tracked, so we will have either a break or a bounce/test.
O - At the open, we essentially open at this SL/support line and drop below. Can't really think of a trade when price opens up right at the line.
E - We come back up, and would you know it, can't go past this SL. Unless you are watching a tick chart, this might not mean much, but my little brain was saying "just short with a market order and watch closely".
F - So after we REJ going higher at the SL, we drop back down again, and retrace up to the DL. An entry below here is called for which clearly works.
G - We make it down to here, and I've already got this level at 64 marked on my chart from earlier. It sure looks like we are rejecting going lower here.
H - We quickly come up to here, but based on the red line, which tracks the move from the spike up after the open at E down to G, this 50% level at 69.50 hasn't been breached, hence this down move is still solid. Shorting below this RET can be done.
I - We do drop lower, but come back up again. This new move from E down to I, as per the green line now, has a 50% level slightly lower, and price does come up to here and penetrates.
J - Now if we consider the move from the swing high at B where our downtrend started, and call the level at "I" the bottom, our 50% level is here now. Price just goes right through.
So once seeing all 50% levels breached, can we put on a long somewhere... anywhere??? Great idea to test of course. I "know" this works often... but I also see where it doesn't work. The question that needs to be answered is how often does it work, and when it doesn't work, where do you have to get out and how many points will it cost you.
K - It just so happens that if we still have that first SL, the shallow one from the overnight high connected with the swing high at A, the line comes to here now. I note that this is the 3rd touch of this SL (first 2 touches make the line, this 3rd one respects the line)
Now am I saying I would short in this strong up move just because price bounced off this line? Not without solid testing of course. The context of the past fews days is that we can barely make higher highs on the daily/hourly charts. So seeing as we are at the top again, heading down is the higher probability.
Anyway, here the SL provided a nice move down after about 15 minutes.
L - This swing low is far too short of the 50% move from the bottom at "I" to the top at "K" here, so not enough weakness yet in this general trend, so if a short was taken at K, its time to get out.... look at how strongly price goes back up again.
CONCLUSION
Well, this is the type of analysis I enjoy. None of this stuff I have seen works well enough that makes me throw money at it. It works when it works, but when its costly when it doesn't. Perhaps I just get too discouraged when I see it work not enough, but I don't realize that stops would keep losses small and the winning points would more than outnumber the losing points.
There is far too much in this analysis to test.... I can't even come up with stats for the first initial thing I'm testing via the 5 min trendlines at the open. But this type of analysis is something I do in real time, and if only I had enough stats from backtesting in my head to go on, I think this would make me quite the nimble trader.
I do feel very stumped right now though... so I need to stare at my 104 charts (105 after today) and see if I can make something simple work... just something to start trading. Even if I only make 10 points after a whole week, having a plan and practicing disciple to trade it would be most welcome right about now. The further I go, the longer the journey it seems.