You are using an out of date browser. It may not display this or other websites correctly.
You should upgrade or use an alternative browser.
You should upgrade or use an alternative browser.
Trading NQ via Price Action
- Thread starter k p
- Start date

")

As part of my ongoing hinge study... here is what I'm looking at right now. This hinge is actually clearer on the 5 min chart. Still waiting to see how it breaks (yes, I'm addicted to watching price in real time). The one at the top from overnight actually stands out quite prominently with the apex that is almost tested from below.
The last thing on this chart that is prominent to me is that support level that seemed to provide quite a bit of support until it broke. I hate it when a break happens but its only an FBO, but then eventually it breaks again for good.
Rest of the day will absolutely be spent backtesting.
The last thing on this chart that is prominent to me is that support level that seemed to provide quite a bit of support until it broke. I hate it when a break happens but its only an FBO, but then eventually it breaks again for good.
Rest of the day will absolutely be spent backtesting.
Attachments
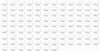
Not much to report today. Of course I got up to watch price, but the focus has really been finally on the backtesting after 9 months of being at this now. Here are 103 charts, starting with the first week of the September contract in the middle of June. The summer trading days are for sure different than the days after Labour day. It might almost make more sense to compile stats for two years over Sep to Nov rather than going from spring to summer to fall. At the same time, I don't think that having "universal" rules that trade price should be drastically different depending on the season. Its just that in the summer, the moves aren't as... hmmm.. powerful perhaps?
It took quite a while to do up these charts. I had to repeat many because after the first few dozen, I needed to put more stuff on the chart. I find it useful to know if a trendline for example is made by only 2 swing points, or rather, that going into the open, price has respected this trendline over 3 or 4 swing highs or lows. So on the one hand, I'm tried to make sure to only track one variable, but its just stupid to not put stuff on the chart that clearly stands out. Furthermore, although a SL for example generally points down from left to right, I also found it helpful sometimes to draw a SL across the tops in a rising trend. In an uptrending market, going into the open I might only have a DL drawn in that never breaks, and yet you see price just take off only a minute or two into the open. I found that by either cloning my DL and transferring it to a swing high (kind of a like drawing a channel) or actually drawing an upslopping SL across the swing highs would give me something to break.
Anyway, long story short, this backtesting is quite a bit of work, but perhaps not that bad. The hard part now is coming up with the numbers. I can see that although I like numbers, I'm way more visual, so I will have to keep it very simple with collecting stats such as hits 5 points profit and max loss is 2, etc. I'm reluctant to be setting profit targets, but once price goes 5 points in my favor perhaps, I would lock in this profit with the stop loss order being moving up to the 5 point profit target area, so my stop loss is essentially 5 points profit even if price might be 8 or 9 points ahead.
I hate those days where price is all over the place, and the trendline actually acts like a mean with price going above or below multiple times. It makes it difficult to either trade the breakout, or trade the reversal. Its obvious though after looking at so many charts one right after another where the same thing is drawn, the 5 minute trendlines often provide a generous move. I would say 15 out of 20 days perhaps, the moves are clean for at least 5 points profit. The trick of course is having a set of rules that limit losses when price is going crazy, and that limit numerous trades where you might just be getting chopped up. But I am certain that as long as a sufficient set of rules are drawn up, and are followed for at least 2 weeks, any loses would more than likely be trader error/not following rules.
On top of this, I'm seeing that waiting for a clean RET on the chart often results in a worse price, and just off the top of my head right now, the feeling also is that it doesn't prevent losses. It might get you into less trades that don't work, but then each loss on this trade is higher. By taking a trade so close to the trendline, you risk trading more perhaps, having more losing trades, but if its a winner you've got more profit, and if its a loser, you're getting out for a smaller loss. This will all come down to the stats of course. On these 1 minute charts its hard to see what happens within the 1 minute bar, so coming up with solid rules of what happens as price approaches a trendline might be difficult, but perhaps my rules can just start based on the next bar.
Anyway, reading all the journals and people saying they have a trading plan, I do wonder why they don't trade it. Why is there so much analysis after the fact, so much mention of what should have been done? Hey... I'm not saying I'm any better, but up till now I have been trading without a plan. Sure I took retracements, but not every one, I was random with them, so this wasn't exactly a trading plan, more like just a guide. Perhaps if you have a plan that says take this trade, but then something pops up that isn't in the trading plan such as a solid resistance level then this is something that one can say requires thought and deliberation which then leads to rationalizing in post. But if people are saying they have a plan and trading it, then what is there to talk about in post?
I guess I never had a plan so that I could rationalize after the fact about what I did or didn't do, and its a comfortable place to be, to be able to fall back onto a good excuse. Anyway, who am I to talk of course. But I figure once a person actually has a trading plan, the only thing to ever discuss at the end of they day is if you followed it or not, and if on this particular day you had the winning trades or the losing trades out of the possible statistical spread of outcomes. Ah... if only it was this easy.
Attachments
But I figure once a person actually has a trading plan, the only thing to ever discuss at the end of they day is if you followed it or not, and if on this particular day you had the winning trades or the losing trades out of the possible statistical spread of outcomes. Ah... if only it was this easy.
KP... some of the questions that I ask myself when reviewing all my trades after the market closes are:
... what were similar symbols doing each time I saw a setup forming
... what did I see prior to the setup that caused me to think a setup was forming
... was this a valid setup/entry or not and why
... was there a better setup/entry after I took the initial trade
... if the trade was not profitable, was there anything that I could have done to minimize the loss
... if the trade was profitable, was there anything that I could have done to maximize the profit
... if the trade was profitable, was there anything that I could have done to minimize any givebacks of profit
... I also review charts looking for missed setups/entries and ask why I didn't see them or act on them and then try to look for ways to identify the missed setups/entries in the future.
... and last: did i keep my losses small, did I let my profitable trades run
cheers
toucan
Ah yes, all of this does make sense. I guess I didn't mean to imply that post analysis is bad, just that in reference to trading, if you really have a plan, the only thing is that you either traded it or didn't. Of course there is always new stuff to add or take away, looking to see what you may have missed and figure out why, etc. But all of this would fall into the category of "further trading plan development". The actual review of the trades should be pretty quick I imagine if you really are trading a well developed plan.
All of us guys posting mind you are all learning, and none of us have a solid plan nor the ability to follow it. So perhaps there never are that many good examples out there. I wish I had something really simple that I could automatically put into places based on levels. Something like.... sell when price is 1 point away from overnight high as you're approaching from the bottom, with a stop loss 2 points above OH (hence a 3 point stop loss). Likewise, buy when 1 point away from OL as price is coming down, and stop loss 2 points below OL. I've seen this isn't good enough, but when it works, it works, so it would be great to have such a solid set of rules that you put on without even thinking or caring. Both with a profit target lets say of 10 points. I don't think this would work 3 out of 5 times sadly, so no way could a plan be this simple.. but it sure would be nice!
Part of the problem for us all is that we are looking at far too many things, so its difficult to actually come of with statistics. Each RET is different based on how far into the move you are, how close you are to potential S or R, how far away you are from a trendline... etc. So just taking retracements entries is a bit choppy. Likewise, the overnight levels can be good, but not often enough. PDH or PDL can also be good, just like the rejection at the PDH today, but once again, doesn't happen often enough. Sigh....
I wish I had something really simple that I could automatically put into places based on levels. Something like.... sell when price is 1 point away from overnight high as you're approaching from the bottom, with a stop loss 2 points above OH (hence a 3 point stop loss). Likewise, buy when 1 point away from OL as price is coming down, and stop loss 2 points below OL. I've seen this isn't good enough, but when it works, it works, so it would be great to have such a solid set of rules that you put on without even thinking or caring. Both with a profit target lets say of 10 points. I don't think this would work 3 out of 5 times sadly, so no way could a plan be this simple.. but it sure would be nice!
Why not test that ? Why do you need 3 out of 5 ? Why do you assume it wouldn't work 3 out of 5 ? What would the results be if it only worked 4 out of 10 ?
Just something to ask yourself. No need to respond
Last edited:
[B said:"k p, post: 4049388, member: 475307"]Ah yes, all of this does make sense. I guess I didn't mean to imply that post analysis is bad, just that in reference to trading, if you really have a plan, the only thing is that you either traded it or didn't. Of course there is always new stuff to add or take away, looking to see what you may have missed and figure out why, etc. But all of this would fall into the category of "further trading plan development". The actual review of the trades should be pretty quick I imagine if you really are trading a well developed plan.[/B]
I don't think it made sense to you. Just because you have a trading plan doesn't mean you don't have to periodically review it. As you said in one of your other recent posts... nq has changed from summer to fall.... and hence, you need to be sure your trading plan still works... same with changing trading symbols. And if its your initial trading plan, its a good thing to review all those items daily.
you continue to want to take short cuts and thats why you get into trouble and are not making better progress in your trading. Trading isn't simple and can't be done profitably unless you are willing to put in the time.
Trading isn't simple and can't be done profitably unless you are willing to put in the time.
Tell me about it. I'm sitting here trying to get stats from all my charts... my 104 charts now, and I cannot even begin. All I can say is that when price trends beautifully and breaks a major trendline, it just goes. But far too often its doing everything possible to hide its true intention/direction.
But in reference to your point, I think we might be perhaps just focusing on two different things. I'm the king of review, of seeing what I should have done, what works and what didn't, etc. But my belief is still that when a person actually has a solid trading plan with an edge, the only thing to discuss in terms of the day's trading is if the trading plan was followed or not. If it was and the results aren't good, then hopefully its just still within the statistical probability of what you expect (the bad string of 3 heads in a row I guess when you're expecting 50/50 heads to tails is still common enough to have to be accounted for).
After this trade review is done, by all means I think you can analyze the day, incorporate the stats of what happened into your plan. Perhaps something that had a 68% success rate might now come down to 67% with this new data. Perhaps over a few weeks you start to see that a strategy is barely making money and only at break even now. But I still think that all of this is outside of the analysis of evaluating the trades that day based on the trading plan.
Once you start to mess with the trading plan, once you change just one variable, then this means you have to go through all the stats to see what this will do now.. correct?
Here is a concrete example. If you're used to taking entries based on 1 tick away from the previous bar, and today you got sucked into 3 bad moves but see that if you only waited for 3 ticks, you wouldn't have been pulled into a bad trade, you still cannot do anything about this for the next trading day. If you want to change your entry criteria to 3 ticks, you'd have to go through all the backtesting again to see if this will in fact be better in the long run versus just better for the odd day... correct?
So by seeing that on this one bad day, your trading plan didn't make you money, it still doesn't mean that anything with regards to the plan needs to be changed. This is why I'm saying that the review of the trading that day should be brief and there is really nothing else to discuss other than if you traded your plan or you didn't. But if you want to start tinkering with the rules of your trading plan, by all means, do it, but this shouldn't happen after every session.
So the point I'm making is that once a trading plan it made, it shouldn't be changed after every day. Perhaps if you have 5 bad days in a row, call it 15 or 20 trades, then perhaps your trading plan never had an edge to begin with. This is the kind of trading plan that I'm searching for at least. You can always add more level of complexity later, but it should be solid enough that on the bad days the loses are small, and the good days more than make up for it.
What hypothesis are you testing? You can't begin if you don't know.
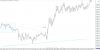
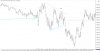
I am looking at two things. First, I am using trendlines, major ones from a 5 minute chart, so essentially encapsulating the entire overnight session, and watching for either a break or reversal trade after the open. The idea being that a change of trend needs to happen with a trendline that occurs over major swing points, not trying to use micro trend lines that I might be inclined to draw if just looking at 1 minute bars. I do draw these on my 1 minute chart, but they would be as drawn on the 5 minute.
So essentially I'm seeing if once there is a break, how far does price continue to go. Even if there isn't a RET above the break, can I essentially just buy or sell close enough to this trendline to make this a profitable trade, and if we break back below, how much against me would price go. The other thing that can happen is a bounce at at the line. I know that trendlines don't act as support or resistance, but many times price does respect these lines because I guess enough traders are watching this very same thing. So I just want to see if any rules can be made around taking trades at these major trend lines. Included are two charts, the first is an example of how it works when it works, the second is messy.
The second thing I'm looking at is hinges and trying to come up with rules about where the best entry, where the stop loss needs to be, etc. Just some statistical analysis. The trouble I'm having of course is as I go through my charts, its easy to see the hinges that work. But hidden within ranges are lots of things that look like hinges that don't go anywhere. In real time, I might be sucked into far too many things I think are hinges that then don't go anywhere so I could get chopped up. One thing I've seen is that the hinge works better when its in the middle of nowhere, not after it starts to form if there is congestion to the left.