Too bad only every 4 years

Yes we should all print the charts of this year in case your broker is so stingy that it doesn't far back with the historical data. I mean before this year, you would have to go all the way back to 2007/2008 to see what volatility is like IF your broker provides it.

We get a Pandemic every 10 - 20 years now. I wish I had charts saved when Swine Flu H1N1 (2009 - 2010) and SARS hit (2002 - 2003).

Unfortunately, those were not Election years.

wrbtrader
 
upload_2020-11-4_16-25-2.png
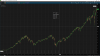
upload_2020-11-4_16-25-2.png The petty and childish arguing is why I only come here once a month or so, and post much less often than that. If anyone is looking for volatility in the overall market, it may come soon and it may not. But as you can see, there have been long periods of low vol for years on end. That's why I have only traded stocks for a long time. There are always stocks moving in a crazy way. Every single day.
 
Yes we should all print the charts of this year in case your broker is so stingy that it doesn't far back with the historical data. I mean before this year, you would have to go all the way back to 2007/2008 to see what volatility is like IF your broker provides it.

This is nothing . Childs play.
 
I did say show me the millions, not a one day screenshot

ps those stonk hardly moved

not sure how you make 16,000 on them

you must have a big wad
 
Back
Top