Hi
I am not an expert in Thinkorswim platform.
I would like to ask a question about P&L graph for a specific strategy.
The strategy is the following, all positions are for the next monthly expiration.
sell 1 2450 PUT
sell 2 /ES
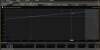
This position is a synthetic short call, and the graph it is similar to a short call, but if we approach the graph you can see that there is an inclination, a slope,
in the left leg but it would have to be flat. I don't know why.
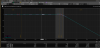
Maybe it's more easy to see if we add a call with same strike.
buy 1 2450 call
I think the resultant graph would have to be flat but it isn't and would like to know the reason.
Thank you.
I am not an expert in Thinkorswim platform.
I would like to ask a question about P&L graph for a specific strategy.
The strategy is the following, all positions are for the next monthly expiration.
sell 1 2450 PUT
sell 2 /ES
This position is a synthetic short call, and the graph it is similar to a short call, but if we approach the graph you can see that there is an inclination, a slope,
in the left leg but it would have to be flat. I don't know why.
Maybe it's more easy to see if we add a call with same strike.
buy 1 2450 call
I think the resultant graph would have to be flat but it isn't and would like to know the reason.
Thank you.