Thinkorswim risk profile question

Hi
I am not an expert in Thinkorswim platform.
I would like to ask a question about P&L graph for a specific strategy.
The strategy is the following, all positions are for the next monthly expiration.
sell 1 2450 PUT
sell 2 /ES
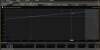
This position is a synthetic short call, and the graph it is similar to a short call, but if we approach the graph you can see that there is an inclination, a slope,
in the left leg but it would have to be flat. I don't know why.
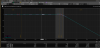
Maybe it's more easy to see if we add a call with same strike.

buy 1 2450 call
I think the resultant graph would have to be flat but it isn't and would like to know the reason.
Thank you.
 
Hi
Yes i forgot to specify the underliyng of the put.
SPX put
and the /ES is an e-mini SP500 index future contract.
I thouhgt that a /ES contract is the half of SPX contract.
 
As this (JUN) future is expiring, the position likely holds (shorts) the SEP.
As the SEP ages, the value of the position would change. The OP doesn't say in which direction the slope occurs, nor whether the graph is 'at expiration' or X-many days to expiration. BUT[!!] the graph (PnL) set-up is a static picture, regardless. So.....

A bit more info would help.
 
Last edited:
TOS might not pick that up.

Why would you graph a spread where you know what the result will look like? You should know what a short call P/L graph looks like.

Hi
Why would you graph a spread where you know what the result will look like?
Sorry but i don't understand the question.
You should know what a short call P/L graph looks like.
yes I do, please what makes you think I do not know?
thank you
 
Because of your opening post.
yes, maybe he wrote his second post before I wrote my second one. No matter
But also I don't think is wrong to graph any position although know the result.
As this (JUN) future is expiring, the position likely holds (shorts) the SEP.
The expiration is the same day.
I add an imatge.
 

Attachments

  • Captura de pantalla (1786).png
    Captura de pantalla (1786).png
    55.5 KB · Views: 35
  • Captura de pantalla (1785).png
    Captura de pantalla (1785).png
    48 KB · Views: 29
Your .pngs really illustrate your bewilderment -- I can't come up with an explanation myself, but then, I am no ToS expert, either. "I got nothin'..." :(
 
yes, maybe he wrote his second post before I wrote my second one. No matter
But also I don't think is wrong to graph any position although know the result.

The expiration is the same day.
I add an imatge.
Short answer: Can't get there from here!

A hint (with TOS Analyze) is the selection of a symbol in the upper left box. You have SPX, which is NOT identical to /ES. (seems you desired to observe Both /ES, and your SPX option) Also note that the TOS Analyze function does NOT permit comingling of different underlying's as you may note from the "Positions and Simulated Trades".
It is uncommon (I think) to find "free" PnL analysis tools of Risk Profile that allow evaluating "mixed assets".

To understand why, this is not typically done, consider that all tools I am aware of for this have one (1) X axis! For TOS, they present the Spot Price across the X-Axis, which is NOT the same as the Future price. --If /ES were selected, then that (the future price) would be used across the X-axis. (close but not the same)
 
Last edited:
Back
Top