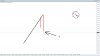
The regularity of the price model in combination of time - volatility

I just want to find specialists of my level and I have a project that will interest them

And I will find them, and you just have to upload the video

for more you are not smart enough

If you want it done, just do it yourself.

 
all the best, tomorrow I’ll repeat the most interesting of my posts, otherwise all kinds of morons will clog the branch with all kinds of trash
 
nick fibo-something guy was also very knowledgable,very academic, & very emotional.
wonder if they are the same guy.

I was very interested in those triangle things.
I lost interest in it years ago.
anyway, all the best to your triangle things.
 
what is a chart - a combination of the current and the next candle.

how many such combinations can be?

It will seem ridiculous to you, but in reality (on any timeframe) there are only 11 of them

A simple question for Gann’s followers, if you need at least 3 candles to build a triangle, and the sequence of 9 moves is unchanged, how many triangles can be built on the daily chart for a month?

Take a close look at the chart and you will understand that in this case the price simply cannot work squared due to volatility, the square is suitable only for flat, only a rectangle is possible on trends

and since three candles are possible only in a pennant, it’s not difficult to understand exactly where he will play the next move
 

Attachments

  • d839a0.png
    d839a0.png
    74.3 KB · Views: 68
Last edited:
the simplest mistake of any wave analysis

what this extreme price belongs to?
 

Attachments

  • Screenshot_4.jpg
    Screenshot_4.jpg
    104.3 KB · Views: 73
If you just learn to read the information that is hidden in the chart itself, and it will easily become clear where the next candles will work, and since the cyclicality of the small timeframe depends on the older one, future designs will no longer cause any doubt
 
Simply put, if the trend lasts only three weeks, then 15-day candles should create 9 moves, think about how this is possible and you will understand a lot.
 
what is a chart - a combination of the current and the next candle.

how many such combinations can be?

It will seem ridiculous to you, but in reality (on any timeframe) there are only 11 of them

A simple question for Gann’s followers, if you need at least 3 candles to build a triangle, and the sequence of 9 moves is unchanged, how many triangles can be built on the daily chart for a month?

Take a close look at the chart and you will understand that in this case the price simply cannot work squared due to volatility, the square is suitable only for flat, only a rectangle is possible on trends

and since three candles are possible only in a pennant, it’s not difficult to understand exactly where he will play the next move

Would gaps between two candles be at least two more combinations? The 11 combinations in the image you posted don't seem to have them.
Allgaps_new.jpg
 
Last edited:
Would gaps between two candles be at least two more combinations? The 11 combinations in the image you posted don't seem to have them.
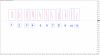
Allgaps_new.jpg
it’s very sad that you are not able to understand the elementary, the price can only open where the previous candle closes, it will take time in nana seconds

I repeat once again, if you are an amateur, you should not comment on my growths, only professionals are interested in me
 
Last edited:
as I said earlier, the price works 2 models at the same time I trade the work of only the main model, the secondary model does not interest me because if you trade two models at the same time you will definitely lose money, because I expected the pound to fall in an hour, as promised, exactly in an hour the pound started fall and continues to fall, as a rule, the gap between the primary and secondary models does not exceed 0.2% and it does not interest me
 
Back
Top