You are using an out of date browser. It may not display this or other websites correctly.
You should upgrade or use an alternative browser.
You should upgrade or use an alternative browser.
The no BS, obfuscation-free price action thread
- Thread starter 1a2b3cppp
- Start date
Quote from 1a2b3cppp:
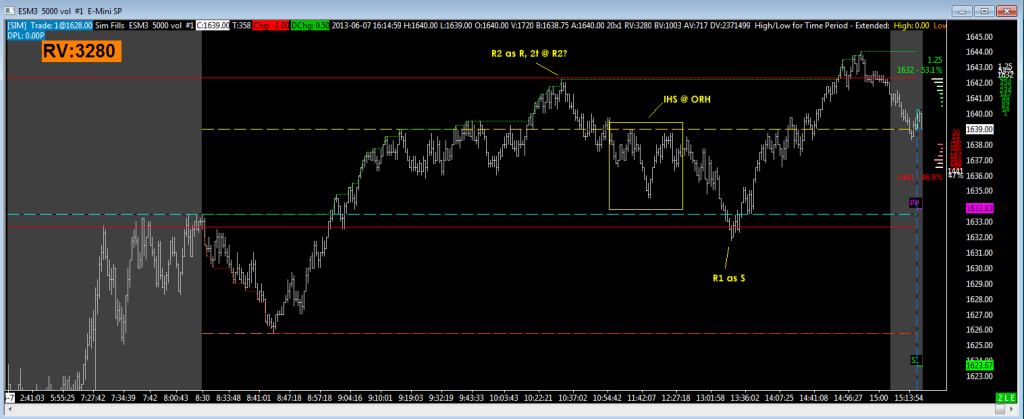
Isn't IHS normally a bottom, though? What happened there?
Simple, the right shoulder broke, so the head was taken.
If you are going to study patterns, study their breakout scenarios, failures, and fake outs. Otherwise you are at a great disadvantage if you using them vs traders that actually studied them.
An inverse head and shoulder is not a reversal formation, but one of consolidation with various outcomes.
Quote from Lord.Maushi:
Simple, the right shoulder broke, so the head was taken.
If you are going to study patterns, study their breakout scenarios, failures, and fake outs. Otherwise you are at a great disadvantage if you using them vs traders that actually studied them.
An inverse head and shoulder is not a reversal formation, but one of consolidation with various outcomes.
I heard IHS was a bottom pattern.
I really wish you well, but I am missing what you are trying to show us. I see your notes on the charts, but what does that have to do with anything? Are you sim trading? If so, then show your trades.
Then perhaps you may get some responses from more experienced traders. Sorry if i have missed something.
BMW
Then perhaps you may get some responses from more experienced traders. Sorry if i have missed something.
BMW
Quote from bmwhendrix:
I really wish you well, but I am missing what you are trying to show us. I see your notes on the charts, but what does that have to do with anything? Are you sim trading? If so, then show your trades.
Then perhaps you may get some responses from more experienced traders. Sorry if i have missed something.
BMW
I'm trying to figure out how to predict where price will go based on price action.
I'm just doing it in a thread to hopefully facilitate discussion rather than just doing it in a journal of my own (which I am also doing on the side for my own notes, and will probably keep doing once this thread dies out since there doesn't seem to be much interest).
Quote from Lucrum:
Considering the extremely short time frame you're looking at, I'm not surprised.
This post would've been better if it said:
5,000 constant volume is too short because...
Instead of 5,000 constant volume, you should try...
Here are some reasons why this other time frame works better...
As far as I know, 5,000 volume charts are a fine timeframe. As I said in the first post, I'm 5,000 volume charts as the middle timeframe, daily ES charts to determine overall "trend" (even though I still don't know how "trend" can be quantified in real time), and 5 second chart to see if I can figure out why some of the reversals on the 5,000 volume chart work and others do not. And Time and Sales and DOM.
I even tried to make a thread about the DOM but it got moved to another forum and filled up with obfuscation.
They represent on average only about 1.3 minutes per bar during RTH.Quote from 1a2b3cppp:
This post would've been better if it said:
5,000 constant volume is too short because...
A longer time frame.Instead of 5,000 constant volume, you should try...
There is no "magic" time frame. But there is generally less "random noise" (for lack of a better description) in longer time frames. The S/R levels tend to be more significant yield bigger moves when broken and are being watched by more participants. The RTH ATR of the ES 5000 CV is only 1 point.Here are some reasons why this other time frame works better...
Then why are you struggling to find any repeating consistently exploitable patterns?As far as I know, 5,000 volume charts are a fine time frame.