You are using an out of date browser. It may not display this or other websites correctly.
You should upgrade or use an alternative browser.
You should upgrade or use an alternative browser.
The no BS, obfuscation-free price action thread
- Thread starter 1a2b3cppp
- Start date
Quote from 1a2b3cppp:
Cool. So how do you determine unfair high and unfair low, and once you do, how to you use fair value in your trading?
spotting the extreme highs and extreme lows , is as easy as spotting ranges ... as its somewhat the same , if u can draw a box
u r good to go...
")
i use those Midpoints , to judge the strenght or weakness. or for entrys.. etc... if a former fair price gets rejected and is now a unfair high or low... this information adds to strenght or weakness..
as in your Emini charts .. we do have weakness building up
on the second picture ..
the fair value of the first picture is somewhat 1645ish
on the third picture .. price wents thru that value and pullsback and now rejects the price .. wich adds to weakness.. and gives an entry opportunity...
Quote from MadeMan:
spotting the extreme highs and extreme lows , is as easy as spotting ranges ... as its somewhat the same , if u can draw a box
u r good to go...
i use those Midpoints , to judge the strenght or weakness. or for entrys.. etc... if a former fair price gets rejected and is now a unfair high or low... this information adds to strenght or weakness..
I'm not sure I understand.
How do you judge strength or weakness? How do you use them for entries?
as in your Emini charts .. we do have weakness building up
on the second picture ..
the fair value of the first picture is somewhat 1645ish
What does that mean? What happens if price gets to 1645ish? Go long? Go short? Do you look for confirmation or do you trade when price touches the value?
on the third picture .. price wents thru that value and pullsback and now rejects the price .. wich adds to weakness.. and gives an entry opportunity...
The third picture is 2 days after the first picture. Hasn't a new fair value been established? Are you still using the fair value from the first picture (1645)?
Also, on your second picture you said "price reacts at the MP." What is MP?
Just a little food for thought. I find this to be a fairly high probability entry. That is when price on ES, NQ and YM all approach the same "place" that you might expect a reversal. I missed it today but here they all essentially reverse at s2.


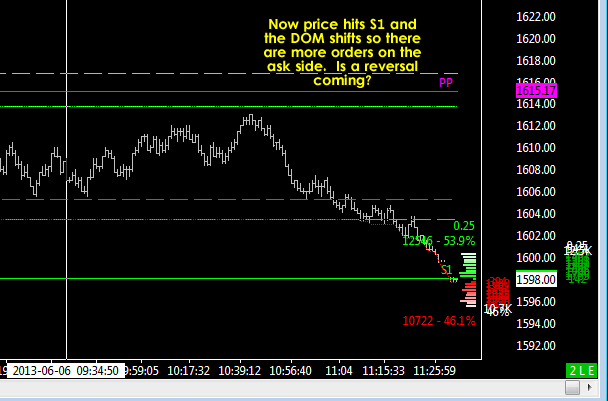
Quote from 1a2b3cppp:
Now as price reaches S1 the DOM shifts so that there is more volume on the ask side. Is price going to start going up here?
Depends on what you call a reversal. The down move lasted approx 44 mins. There was a 61.8 retrace of that down move. The retrace lasted approx 48 mins, although the retrace may still in play as I post, which is 1:42p EST.
Hindsight chart reading is fun!!

Trade On!
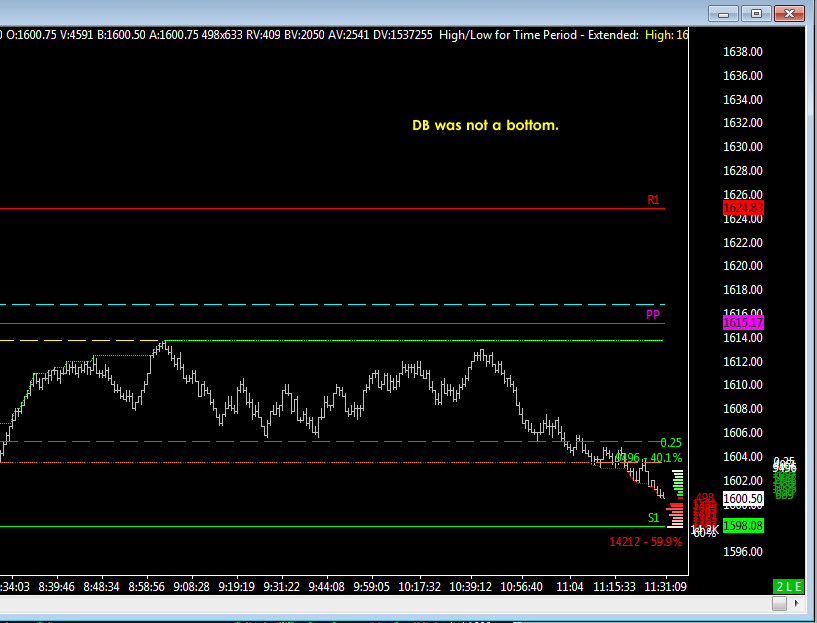
Here's today's chart:
ES 6-6 5000 volume chart
It ended up being quite the reversal!
ES 6-6 5000 volume chart
Quote from tiddlywinks:
Depends on what you call a reversal. The down move lasted approx 44 mins. There was a 61.8 retrace of that down move. The retrace lasted approx 48 mins, although the retrace may still in play as I post, which is 1:42p EST.
Hindsight chart reading is fun!!
Trade On!
It ended up being quite the reversal!