A small non-sequitur... but I'm pretty proud of this little histogram as it represents a decent amount of work. It's been said that ACD helps filter out the noise, and it appears I've found one way of doing that. This is over a three year period for this particular security.
You are using an out of date browser. It may not display this or other websites correctly.
You should upgrade or use an alternative browser.
You should upgrade or use an alternative browser.
The ACD Method
- Thread starter sbrowne126
- Start date
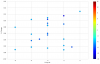
Would you mind explaining more about your findings?A small non-sequitur... but I'm pretty proud of this little histogram as it represents a decent amount of work. It's been said that ACD helps filter out the noise, and it appears I've found one way of doing that. This is over a three year period for this particular security.
Thanks.
Last edited:
Would you mind exploring more about your findings?
Thanks.
Sure, the histogram is essentially showing the historical returns based on entering a trade given specific conditions. The x-axis is the 5 Day Number Line, y-axis being the % returns (should actually be the value*100 for the %), and the color bar is the 10 Day Number Line. There are two more filters applied, but as you can see these conditions have yielded a 100% historical hit rate.
Understood, nice chart.Sure, the histogram is essentially showing the historical returns based on entering a trade given specific conditions. The x-axis is the 5 Day Number Line, y-axis being the % returns (should actually be the value*100 for the %), and the color bar is the 10 Day Number Line. There are two more filters applied, but as you can see these conditions have yielded a 100% historical hit rate.
Out of curiosity is that plotted with ggplot2 using alpha fill? Looks a little R'ish to me
") .
.Understood, nice chart.
Out of curiosity is that plotted with ggplot2 using alpha fill? Looks a little R'ish to me
This is all python-driven research (pandas, numpy) with matplotlib being used for charting/graphs.
A small non-sequitur... but I'm pretty proud of this little histogram as it represents a decent amount of work. It's been said that ACD helps filter out the noise, and it appears I've found one way of doing that. This is over a three year period for this particular security.
In order to test this, you have to account for some alternative. In other words, had I randomly bought that same security over the 3 year period, what were the returns and are your results statistically significantly different then the null comparison. Otherwise the results are meaningless.
Please guys, when you run tests, make sure you are testing your ideas against a null alternative. It doesn't even have to be the same stock, it can be the S&P 500 if you are testing stocks.
Alternatively you can run stock XYZ over the performance of the ES and use the sharpe as the output.
Alternatively you can run stock XYZ over the performance of the ES and use the sharpe as the output.
Please guys, when you run tests, make sure you are testing your ideas against a null alternative. It doesn't even have to be the same stock, it can be the S&P 500 if you are testing stocks.
Alternatively you can run stock XYZ over the performance of the ES and use the sharpe as the output.
Thanks for the suggestions, these are just preliminary data points as I'm not that far into it yet...
A small non-sequitur... but I'm pretty proud of this little histogram as it represents a decent amount of work. It's been said that ACD helps filter out the noise, and it appears I've found one way of doing that. This is over a three year period for this particular security.
Huh? I thought you didn't care for ACD? Now you've been coding and doing data analysis for a system you don't care for?
I believe you're talking to DeltaRisk... Our handles are too similar!Huh? I thought you didn't care for ACD? Now you've been coding and doing data analysis for a system you don't care for?