You are using an out of date browser. It may not display this or other websites correctly.
You should upgrade or use an alternative browser.
You should upgrade or use an alternative browser.
Technical Question about Candlestick Bar ?
- Thread starter TradeTune
- Start date

How to know these yellow highlighted candlestick bars wicks that spiked, upper or lower one happened first? without having to open a lower time to see where they headed first.
Are there other type of bars that can tell you that?
Thank you
View attachment 247719
Watch it as it occurs in real-time...you'll then know which one occurred first.
wrbtrader
Watch it as it occurs in real-time...you'll then know which one occurred first.
wrbtrader
Hahahaaa .. You are very entertaining
Maybe there someone created a custom study that color code the candle bar, Like Paint bar studies in Easy language. but couldn't find one yet
Hahahaaa .. You are very entertaining
Maybe there someone created a custom study that color code the candle bar, Like Paint bar studies in Easy language. but couldn't find one yet
I helped designed color codes in "easylanguage" for Omega Research that did exactly what you're asking about...
Today, Omega Research is known as TradeStation.
wrbtrader
Candlestick bars use the standard EOD or minute data that is open,high,low,close; the colar of the bar depends on only open and close; It does not tell which of low and high happens first. I asked a question about how to guess a few weeks ago on ET. No accurate solution except using tick data.

it's a function of the time frame that the candle is calculated on. I find that using shorter time interval candles such as 1 minute for daytrading is a great approach. That's a very interesting question. The main point is why would one want to look at that. The correct use of candles depends on the classic candlestick pattern interpretation, eg hammers etc
That's a very smart question, like you said you normally have to look at a lower time frame to see the data points Illustrated that form the candle pattern to answer that. A puzzle...
Terr, any relation to medved quotetracker? Used to like it, from Jerry n Mike back in the day
That's a very smart question, like you said you normally have to look at a lower time frame to see the data points Illustrated that form the candle pattern to answer that. A puzzle...
Terr, any relation to medved quotetracker? Used to like it, from Jerry n Mike back in the day
Last edited:
it's a function of the time frame that the candle is calculated on. I find that using shorter time interval candles such as 1 minute for daytrading is a great approach. That's a very interesting question. The main point is why would one want to look at that. The correct use of candles depends on the classic candlestick pattern interpretation, eg hammers etc
That's a very smart question, like you said you normally have to look at a lower time frame to see the data points Illustrated that form the candle pattern to answer that. A puzzle...
Terr, any relation to medved quotetracker? Used to like it, from Jerry n Mike back in the day
People might want to know that to tweak their executions or to see whether and how the price movement of especially a longer timeframe candle like a day candle matched the unfolding of certain market-impacting events to study how the market reacts to events. Just two of the reasons what come to my mind.
lots of different ways
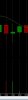
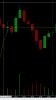
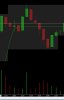
did u catch the error in this example? notice the times are different here is the correct chart
of the 60 min candle
did u catch the error in this example? notice the times are different here is the correct chart
of the 60 min candle
Attachments
Last edited: