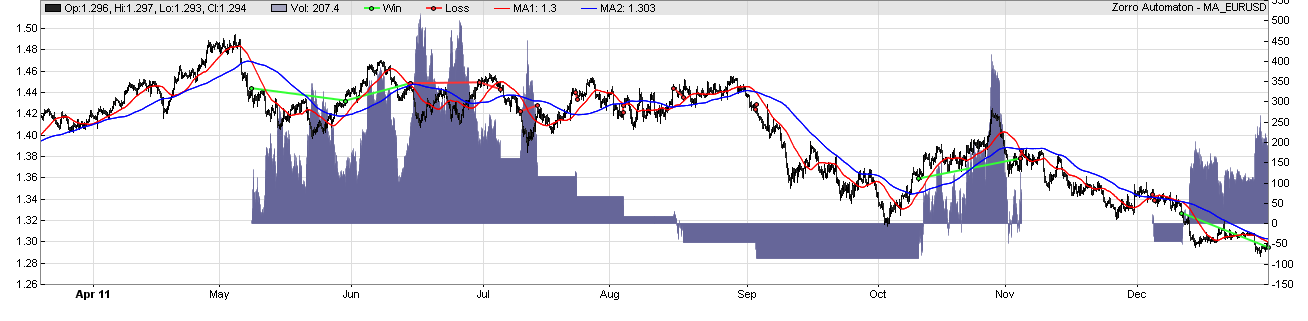
Here is something I did over a year ago in R. It is a simple 30 minute cross on the SPX intraday, i.e., if the 30 minute SMA crosses the price, then enter or exit. PL curve attached.
lastmin = 388
simday = function(datestr,plotflag=FALSE) {
day = as.Date(datestr)
spxidx = spx$Date==day
flipvec = vector()
#print(spx$Date[spxidx])
totpl = 0.0
maxpl = 0.0
maxtime = 0
firstpos = 0.0
firsttime = 0
ncross = 0
if (sum(spxidx)==390) {
#print(as.Date(day,origin="1970-01-01"))
#flush.console()
open = spx$Open[spxidx]
high = spx$High[spxidx]
low = spx$Low[spxidx]
close = spx$Close[spxidx]
sma30 = spx$SMA30[spxidx]
status = "cash"
price = 0.0
for (imin in seq(sum(spxidx))) {
if (imin >= 40 && imin < lastmin) {
if (status!="short" && close[imin]<sma30[imin]) {
status = "short"
ncross = ncross+1
pl = 0.0
if (price>0.0) {
pl = (low[imin]-price)
totpl = totpl+pl
if (totpl>maxpl) {
maxpl = totpl
maxtime = imin
}
if (firsttime==0 && totpl>0) {
firsttime = imin
firstpos = totpl
}
}
price = low[imin]
print(paste("short",as.Date(day,origin="1970-01-01"),imin,price,pl,totpl))
flipvec = c(flipvec,imin)
}
if (status!="long" && close[imin]>sma30[imin]) {
status = "long"
ncross = ncross+1
pl = 0.0
if (price>0.0) {
pl = (price-high[imin])
totpl = totpl+pl
if (totpl>maxpl) {
maxpl = totpl
maxtime = imin
}
if (firsttime==0 && totpl>0) {
firsttime = imin
firstpos = totpl
}
}
price = high[imin]
print(paste("long",as.Date(day,origin="1970-01-01"),imin,price,pl,totpl))
flipvec = c(flipvec,imin)
}
}
}
# close positions at end of day
imin = lastmin
if (status=="long") {
pl = 0.0
if (price>0.0) {
pl = (low[imin]-price)
totpl = totpl+pl
}
if (totpl>maxpl) {
maxpl = totpl
maxtime = imin
}
if (firsttime==0 && totpl>0) {
firsttime = imin
firstpos = totpl
}
price = low[imin]
print(paste("eod close long",as.Date(day,origin="1970-01-01"),imin,price,pl,totpl))
flipvec = c(flipvec,imin)
}
else if (status=="short") {
pl = 0.0
if (price>0.0) {
pl = (price-high[imin])
totpl = totpl+pl
}
if (totpl>maxpl) {
maxpl = totpl
maxtime = imin
}
if (firsttime==0 && totpl>0) {
firsttime = imin
firstpos = totpl
}
price = high[imin]
print(paste("eod close short",as.Date(day,origin="1970-01-01"),imin,price,pl,totpl))
flipvec = c(flipvec,imin)
}
print(paste(as.Date(day,origin="1970-01-01"),ncross,totpl))
flush.console()
if (plotflag) {
plot(close,type="l",col="blue",main=datestr)
plot.xy(xy.coords(seq(length(close)),sma30),type="l",col="red")
abline(v=flipvec,col="green")
grid()
}
}
c(totpl,ncross,maxpl,maxtime,firstpos,firsttime)
}
spx = read.table("spx.csv",sep=",",stringsAsFactors=FALSE,header=TRUE)
spx$Date = as.Date(spx$Date,format="%m/%d/%Y")
datevec = unique(spx$Date)
ndays = length(datevec)
plvec = vector()
simdates = vector()
ncrossvec = vector()
maxplvec = vector()
maxtvec = vector()
firstplvec = vector()
firsttvec = vector()
for (day in datevec[1:ndays]) {
retvec = simday(as.character(as.Date(day,origin="1970-01-01")))
totpl = retvec[1]
ncross = retvec[2]
maxpl = retvec[3]
maxtime = retvec[4]
firstpl = retvec[5]
firstt = retvec[6]
if (totpl!=0.0) {
plvec = c(plvec,totpl)
simdates = c(simdates,as.Date(day,origin="1970-01-01"))
ncrossvec = c(ncrossvec,ncross)
maxplvec = c(maxplvec,maxpl)
maxtvec = c(maxtvec,maxtime)
firstplvec = c(firstplvec,firstpl)
firsttvec = c(firsttvec,firstt)
}
}
pldat = data.frame(date=as.Date(simdates,origin="1970-01-01"),pl=plvec,ncross=ncrossvec,maxpl=maxplvec,maxt=maxtvec,firstpl=firstplvec,firstt=firsttvec)