You are using an out of date browser. It may not display this or other websites correctly.
You should upgrade or use an alternative browser.
You should upgrade or use an alternative browser.
Stocks Analysis Using Price Action
- Thread starter Gringo
- Start date
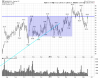
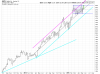
TSLA seems to like SLA particularly well.


Gringo
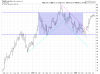
is that a head and shoulders possibly forming on TSLA?
is that a head and shoulders possibly forming on TSLA?
I don't pay attention to patterns. Price is currently rising. Even if it's head and shoulders generally speaking people wait for the neckline to break. I am not beholden by any such rules. Around that resistance if price weakens it's a short otherwise not. By the time neck line breaks it's already too late in my opinion.
Gringo
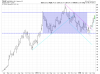
AAPL needs to be watched closely here. A turn downwards here or around the upper TC would be places where a short might present itself. AAPL and NQ have been moving reasonably in tandem so I keep an eye on both.


Gringo
Gringo
Attachments
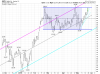
hey gringo did u ever thought about combining your threads and pick the best stocks to trade upon ?
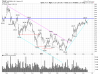
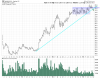
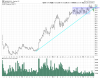
like SPY > compare the sectors >pick the strongest sectors >pick the strongest stock within that sector , vice versa for shorts ?
like so... (example)
xlv Vs.Spy weekly

xlv vs Stock vs. spy daily

xlv vs. stock H1

like SPY > compare the sectors >pick the strongest sectors >pick the strongest stock within that sector , vice versa for shorts ?
like so... (example)
xlv Vs.Spy weekly
xlv vs Stock vs. spy daily
xlv vs. stock H1
is that a head and shoulders possibly forming on TSLA?
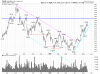
My concern with the TSLA H/S is that it seems a little bit too convenient/obvious to anyone looking at the chart. Retail is most likely going to jump on that and big money is probably going to rip their faces off (while their shorts are being filled in the process).
hey gringo did u ever thought about combining your threads and pick the best stocks to trade upon ?
like SPY > compare the sectors >pick the strongest sectors >pick the strongest stock within that sector , vice versa for shorts ?
like so... (example)
xlv Vs.Spy weekly
View attachment 153758
xlv vs Stock vs. spy daily
View attachment 153759
xlv vs. stock H1
View attachment 153760
It's just easier and less time consuming to focus on the index. Stocks are not bad but there's an extra bit of risk with earnings etc.
My concern with the TSLA H/S is that it seems a little bit too convenient/obvious to anyone looking at the chart. Retail is most likely going to jump on that and big money is probably going to rip their faces off (while their shorts are being filled in the process).
TSLA has already been close enough to the 260 level. I don't know if it's going to come back to test it again or head down. I am not a buyer at this level. It's either short or an avoid until the R is cleared.
Gringo