
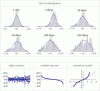
^SPX Return's histogram (Daily since 2 years)

I found it interesting.
I found the 5 days downside amazing.
Downside moves are much quicker than upside ones.
It takes 5 days to reach -11% vs 20 days to achieve 11%.
After the 20 days histogram ... It doesn't move that much ...

That's why it's rewarding to be able to time the market.
Short term speculators can achieve in a week or a month,
What investors achieve in 250 days and more ...

I also notice a kind of mean reversion between 50 and 100 days.
Of course. We're talking about extreme values. Low Porbability events.

Questions. How to interpret the "Normal q-q plot" ?

Comments are welcome.
 

Attachments
  • image.gif
    image.gif
    38.1 KB · Views: 142
Last edited:
"Works on my machine..."
bitly suggests that you
  • Change the original link, and re-shorten with bitly
  • Close your browser window
  • Notify the sender of the URL
Or, continue at your own risk to
...

Ok, elevator stairs stocks ?
 
I found it interesting.
I found the 5 days downside amazing.
Downside moves are much quicker than upside ones.
It takes 5 days to reach -11% vs 20 days to achieve 11%.
After the 20 days histogram ... It doesn't move that much ...

That's why it's rewarding to be able to time the market.
Short term speculators can achieve in a week or a month,
What investors achieve in 250 days and more ...

I also notice a kind of mean reversion between 50 and 100 days.
Of course. We're talking about extreme values. Low Porbability events.

Questions. How to interpret the "Normal q-q plot" ?

Comments are welcome.
From where have you got that image?
Usually it was embedded into a text, and the text will usually explain it, isn't it?
q-q plot is explained on wiki: https://en.wikipedia.org/wiki/Q–Q_plot
Simply said it is about plotting all the daily percent returns after cumulating in percentile groups... It's about the distribution of the daily returns...
 
Last edited:
From where have you got that image?
Usually it was embedded into a text, and the text will usually explain it, isn't it?
q-q plot is explained on wiki: https://en.wikipedia.org/wiki/Q–Q_plot
Simply said it is about plotting all the daily percent returns after cumulating in percentile groups... It's about the distribution of the daily returns...

Thanks for the link and the explanation.
Oddtrader has been very informative too.

I got it from WolframAlpha application.
There was no text related to that image.

Thanks.
 
Short speculators are gamblers and gamblers lose everything at some point. See this analysis that indicates a strong edge even if you hold just random long positions.
Short speculators are gamblers ?
Hold random long positions ?
XD ... That's funny.

Don't know what's your definition of a gambler ...
But "Random" and "Hold" whatever happens,
Suit perfectly well that attitude.

It's not the bias that indicates Gambling,
But the Risk / Ruin management.
As well as the Expectancy.
 
Last edited:
Back
Top