

I found it interesting.
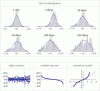
I found the 5 days downside amazing.
Downside moves are much quicker than upside ones.
It takes 5 days to reach -11% vs 20 days to achieve 11%.
After the 20 days histogram ... It doesn't move that much ...
That's why it's rewarding to be able to time the market.
Short term speculators can achieve in a week or a month,
What investors achieve in 250 days and more ...
I also notice a kind of mean reversion between 50 and 100 days.
Of course. We're talking about extreme values. Low Porbability events.
Questions. How to interpret the "Normal q-q plot" ?
Comments are welcome.
I found the 5 days downside amazing.
Downside moves are much quicker than upside ones.
It takes 5 days to reach -11% vs 20 days to achieve 11%.
After the 20 days histogram ... It doesn't move that much ...
That's why it's rewarding to be able to time the market.
Short term speculators can achieve in a week or a month,
What investors achieve in 250 days and more ...
I also notice a kind of mean reversion between 50 and 100 days.
Of course. We're talking about extreme values. Low Porbability events.
Questions. How to interpret the "Normal q-q plot" ?
Comments are welcome.
Attachments
Last edited:

