Some ways to define a Trend.

Trend is where the bank is relative to where the price is. The bank is always on the profitable side of the price, while the 99% "successful" and positive-waves spewing internet gamblers are on the other side.
From what is read I realize now that I am almost always the bank !!!!! Huray !!!! :D
Almost forgot.... should add: Like almost all traders on ET!! :p
 
From what is read I realize now that I am almost always the bank !!!!! Huray !!!! :D
Almost forgot.... should add: Like almost all traders on ET!! :p

Yes, I know. But you can't talk about it. So I won't ask. It will save you from registering another account.
 
Yes, I know. But you can't talk about it. So I won't ask. It will save you from registering another account.
It was a joke... I will never ever again discuss performance. Learned in past that it is useless.
I don't have to register a new account, I have enough accounts to jump from one to another. I have more accounts here then trading accounts. :p:D:p:D
 
Wow, I'm impressed. Curiosity is critical when studying the market as a prelude to developing a trading plan. Kudos to you.
When I started to build a system for trading, which was when I was still so naive that I would become a millionaire, I took one minute to think where to start from. My conclusion was that I should not read anything but start on my own and follow logical and out of the box steps. Why? Because everything you can read was already tried thousands of times and was not successful enough for me. If something would really be successful the whole world would be using it. On top of that I am sure that the really interesting things will never be published so you cannot read them anywhere. If you read about strategies, patterns or ways to start trading, your thinking will be influenced by your subconscious which will make it difficult to think out of the box. You will be forced to think like you read and like millions did before you without any real success.

In the past I was treasury manager. When I asked some of my employees : why did you do this in this way? Their answer was mostly: because i was thought to do it like this when I started in this company. I prefer a logical explanation over this, to me stupid answer. It is not because somebody before you worked in a certain way that this will always be the best way to work. You should be alert and often ask yourself: why this way? Is there not a better way?

Past confirmed that the way I started was the best way, although a few times I thought I made the wrong decision to think out of the box. But I must admit that it took me a fairly long time to become a good trader.


I never ever drew one line on a chart, not S/R, not Fibonacci, not MA, not Bollinger, nothing. For me it was possible to draw 100 lines on a chart. So which one would be good and which one not? And if you draw enough lines you can always explain in hindsight that you were correct. To me it looked like useless.

But we have a saying: every man kisses his wife his own way.

So everything can work. But the ultimate goal is to find the BEST way to work. The wholy grail. And if you find it it will give you great satisfaction, not for the money but for the achievement.
 
Last edited:
When I started to build a system for trading, which was when I was still so naive that I would become a millionaire, I took one minute to think where to start from. My conclusion was that I should not read anything but start on my own and follow logical and out of the box steps. Why? Because everything you can read was already tried thousands of times and was not successful enough for me. If something would really be successful the whole world would be using it. On top of that I am sure that the really interesting things will never be published so you cannot read them anywhere. If you read about strategies, patterns or ways to start trading, your thinking will be influenced by your subconscious which will make it difficult to think out of the box. You will be forced to think like you read and like millions did before you without any real success.

In the past I was treasury manager. When I asked some of my employees : why did you do this in this way? Their answer was mostly: because i was thought to do it like this when I started in this company. I prefer a logical explanation over this, to me stupid answer. It is not because somebody before you worked in a certain way that this will always be the best way to work. You should be alert and often ask yourself: why this way? Is there not a better way?

Past confirmed that the way I started was the best way, although a few times I thought I made the wrong decision to think out of the box. But I must admit that it took me a fairly long time to become a good trader.


I never ever drew one line on a chart, not S/R, not Fibonacci, not MA, not Bollinger, nothing. For me it was possible to draw 100 lines on a chart. So which one would be good and which one not? And if you draw enough lines you can always explain in hindsight that you were correct. To me it looked like useless.

But we have a saying: every man kisses his wife his own way.

So everything can work. But the ultimate goal is to find the BEST way to work. The wholy grail. And if you find it it will give you great satisfaction, not for the money but for the achievement.

On another website, there was a "discussion" regarding the value of studying accounts of losers vs accounts of winners. I suggested that a better choice was to study the market.

Not everyone, however, is able to "see" it without aid. Indicators, trendlines, patterns and so on can act as a sort of prescription lens to enable the beginner to see the motives and intentions behind what appears to be chaos. All of these things, however, are no more than tools, preferably temporary. If one can't tell the difference between up and down without them, he will be doomed to the Titanic Method of Trading, re-arranging, tweaking, modifying, struggling, failing.
 
Everything can work. So no need to wasting time finding the holy grail.
Yes, everything can work. System A can make 10$ a day, and the holy grail can make maybe 100 000$ a day. But I agree they both work. Nevertheless I would prefer the holy grail, as would everybody who is no masochistic. I prefer to work 1 day and take the rest of the year holiday, instead of working a few years to make the same amount of money.
 
Yes, everything can work. System A can make 10$ a day, and the holy grail can make maybe 100 000$ a day. But I agree they both work. Nevertheless I would prefer the holy grail, as would everybody who is no masochistic. I prefer to work 1 day and take the rest of the year holiday, instead of working a few years to make the same amount of money.

Unless your already fairly rich, like most of us you have to start with a relatively small account $700 in my case and 15months later have $6000 and some drawings, fitting trading around work, life, shite.

So it takes loads of mind numbing time when cracked to get to a profitable level :(

So the grail is the ability to keep going to build to 100k per day eventually.

2k per day is my goal average ofcourse, trade 2 days per week and enough to enjoy the other 5 days.
 
I prefer using combination of John Hill's "Thrust Bar" in his book "Stock & Commodity Market Trend Trading by Advanced Technical Analysis-1978" and closing beyond last pivot providing this pivot is not an outside bar as most of my methods use this to define trend for trading Price action. If I have included an Expo moving average, I will look for a bar's range that is completely above a EMA and that certainly is a "Thrust Bar" for defining trend, this approach is often more conservative than close beyond a pivot. The bonus for me using this are spikes as there was strong move up/down in Crude today intra day, and kept me from trading since one of my rules is when volatility increases too much or whipping back and forth, I won't trade. Enclosed is also daily Sugar with good examples using Reverse Divergence, nothing new except for those it may be new. But remember always back test and form your own opinions/rules. Higher indicator reading but lower highs in downtrend and lower readings higher lows in uptrend. Note: Lag in indicator will not correspond to highs for few bars, I prefer much slower so that reduce false signals.
 

Attachments

  • THRUST BARS AND REV DIV.png
    THRUST BARS AND REV DIV.png
    63.5 KB · Views: 149
Wow, I'm impressed. Curiosity is critical when studying the market as a prelude to developing a trading plan. Kudos to you.

What you have is correct, but the details are largely unnecessary. Introducing too many elements into your decision-making process -- criteria, checklists, components -- will make the whole thing so complicated that by the time you've been through all this and decided to take the trade, it's gone. Therefore, simple is best.

The perfect example found in books and in software sales literature is correct as far as it goes. But reality doesn't always cooperate. For example, the standard example, which is not difficult to find, consists of price hitting the top of what will become a range, reversing to a level where many trades are conducted, then falling to a level which will become the bottom of the range, then returning to the middle, then back down to the bottom or continuing on to the top and so on. So what you end up with is a lot of trades in the middle -- i.e., "value" -- with comparatively fewer at the top and at the bottom. If you know how to trade reversals and do so at the top and bottom, you can make some money. If you try to trade in the middle, you will most likely be chopped up in the trendlessness. And there are plenty of trends which have tons of trades along the upper level and the lower level, hence loads of volume, but relatively little in the middle, or the "mean". Sometimes price lingers at that mean and this will be revealed in a volume analysis of some sort, like Volume At Price. However, price will often shoot right through the mean on its way to the opposite extreme, creating greater volume at those extremes and two "value areas".

Therefore, if you want to turn all of this to your advantage, you must get past software and theory and guruspeak and focus on what traders want to accomplish and what they're doing in order to accomplish it. Right now, for example, we are at the top of a long-term trend channel in the NQ. We've been here for several days. But at some point sellers will try to entice buyers to pay higher prices and price will rise, perhaps creating a more acute trend channel, or buyers will force sellers to accept lower prices and price will fall. The following chart was posted Saturday and provides an example:

index.php


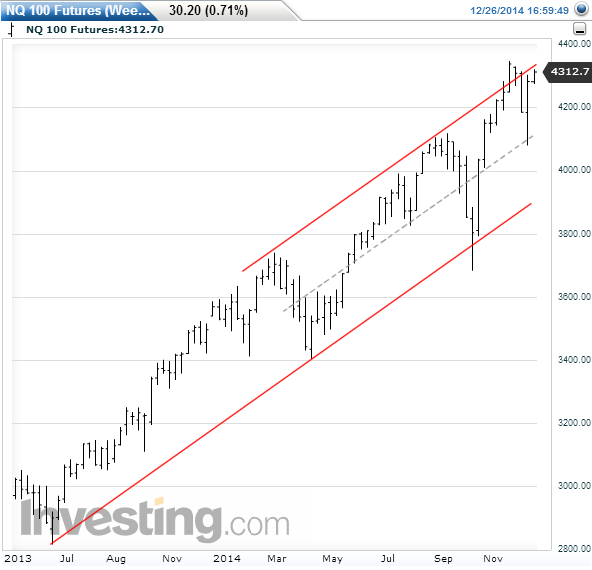
If traders want to take prices lower, or if they don't want to take prices lower but are dragged into doing so anyway, and you trade a longer bar interval, hourly or daily, you may have a nice ride down to the "mean" or even the lower limit of this channel. But even if you trade a shorter interval, something that can be traded within a day (15m, 5m, 1m), an understanding of what traders have in mind may give you a clue as to whether you ought to be focusing on the short side or the long.

Some instruments, like this one, are simple. They're mean-reverting and all one has to do is trade the reversals, sort of like pinball. Other instruments are not mean-reverting and provide few if any clues as to what they're going to do, when they're going to do it, and how far they're likely to go. I prefer the simple, but not everyone does. Then there's scalping, which is still an auction market, but charts aren't going to do you much good, if any.

If you want to read what I came up with after going through essentially the same process you did, see this, pages 31 through 42. You may find this to be more practical when it comes to actual trading and making actual trading decisions.

Thanks for linking the document. It was a very interesting read. It packs in a lot of info. I am jotting down my current understanding below. Would be great if you could answer the questions I raise.

How To Determine Support And Resistance Levels Using AMT
  1. Inside-Out Heuristic (using market profile): Count the number of votes cast for each price candidate. The prices with highest vote count are the winner (fair value). Prices getting the bottom 30% of the votes can be considered as support and resistance regions. Look for reversals and breakouts in these regions.
  2. Outside-In Heuristic (using trend channels): Just focus on extremes since that is where trading opportunities arise. Draw straight lines through swing lows and swing highs. These straight lines are good estimates of support and resistance levels. DBPhoenix (SLA-AMT document) simplifies this even more by insisting that only demand line (support trend line) need be drawn. The Resistance line and the mean line are assumed to be parallel to the demand line.

Doubts And Questions
  1. How is Inside-Out Heuristic different from indicators like Bollinger Bands? A price that gets a lot of votes in terms of time points should be pretty close to the arithmetic mean. A price that gets a lot of votes in terms of transaction volume should be pretty close to volume-weighted average price (VWAP). Perhaps because price distribution is not Gaussian, the values obtained by averaging diverge from values obtained by counting discrete votes?
  2. The Outside-In Heuristic assumes that trend channels based on straight lines are good estimators of support and resistance levels. This assumption in turn implies that support and resistance levels change linearly with time. Why should it be so?

Still digestion your doc. Also download Mind Over Markets recently, haven't started reading it yet.

To clarify some terminology (fair value, votes etc.) used above, I am re-summarizing AMT (like I did in previous post).

Auction Market Theory
  1. Markets are price discovery mechanisms - they help in answering the question "what is the fair value of this asset?"
  2. This fair value is discovered by interaction between buyers (demand) and sellers (supply). Buyers and Seller vote on what they consider as fair prices.
  3. Among various price candidates, the ones getting most votes can be regarded as what the market considers the fair value of the asset at the current moment.
  4. Votes can be measured by time or volume. The number of votes cast for a price candidate can be measured by the amount of time during which asset gets traded at that price candidate. Alternatively, number of votes cast for a price candidate can be measured by the number of transactions that take place at that price. If certain price candidates occur during a lot of time points, or if a lot of transactions take place at certain price candidates, then those price candidates are the winner and can be regarded as fair value of the asset.
  5. Trading strategy: avoid trading at when asset is trading at fair values since it is properly priced. Look for opportunities when prices move away from fair values. When price moves away from fair value then look out for a reversal or a breakout.
 
Back
Top