Geometric Brownian Motion
A stochastic, non-linear process to model asset price
Roman Paolucci
Ifyou have read any of my previous finance articles you’ll notice that in many of them I reference a diffusion or stochastic process known as geometric Brownian motion. I wanted to formally discuss this process in an article entirely dedicated to it which can be seen as an extension to
Martingales and Markov Processes. In this article, I want to discuss the purpose and practical applications of this process.
Theoretical applications
The best way to explain geometric Brownian motion is by giving an example where the model itself is required. Consider a portfolio consisting of an option and an offsetting position in the underlying asset relative to the option’s delta.
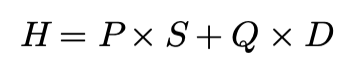
Hedge portfolio
Variables:
- P — Shares of the underlying asset
- S — Price of the underlying asset
- Q — Shares of the derivative (option)
- D — Value of the derivative
- H — Value of the portfolio
To those of you with more financial experience, or that have read my previous articles, you’ll recognize this as the argument for the Black-Scholes theoretical option pricing model (For a complete derivation and explanation see
Deriving the Black-Scholes Model). Note that we can determine the shares (P and Q) of either asset in the portfolio, but we cannot control their values (S and D). In order to determine how to model the option’s price based on this portfolio, we first need to determine a way to model the underlying asset.
Practical applications
Though theoretical applications are important, your primary interest may be as a practitioner. Consider yourself a portfolio manager, based on your team’s market research you are trying to determine the average return of your portfolio. Using geometric Brownian motion in tandem with your research, you can derive various sample paths each asset in your portfolio may follow. This will give you an entire set of statistics associated with portfolio performance from maximum drawdown to expected return. There are uses for geometric Brownian motion in pricing derivatives as well. If you are the underwriter for some exotic you need a way to determine the premium to charge for the risk on your end. One way to accomplish this is to programmatically implement the exotic in a set of sample paths generated by geometric Brownian motion, discounting the average value of the payoff to the present resulting in the fair value of the exotic. For a complete explanation with code see
Python for Pricing Exotics or check out the following video.
In the case of either of these applications, we need a way to model the underlying asset.
Mathematical notation
To more accurately model the underlying asset in theory/practice we can modify Brownian motion to include a drift term capturing growth over time and random shocks to that growth.
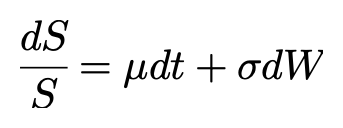
The expression for geometric Brownian motion is actually quite simple…
Geometric Brownian motion
Variables:
- dS — Change in asset price over the time period
- S — Asset price for the previous (or initial) period
- µ — Expected return for the time period or the Drift
- dt — The change in time (one period of time)
- σ — Volatility term (a measure of spread)
- dW — Change in Brownian motion term
Terms:
- dS/S — Return for a given time period
- µdt — Expected return for the time period
- σdW — Random shock to expected return for the time period
Since there is a degree of randomness in this model, every time it's used to simulate an asset’s price it will generate a new path.
Let’s use this equation along with Python to generate a sample path for an asset.
First, we need to build a class that takes in the parameters associated with this model…
Next, we need to create a function that takes a step into the future based on geometric Brownian motion and the size of our time_period all the way into the future until we reach the total_time.
Note: Both time_period and total_time are annualized meaning 1, in either case, refers to 1 year, 1/365 = daily, 1/52 = weekly, 1/12 = monthly.
In the
simulate function, we create a new change to the assets price based on geometric Brownian motion and add it to the previous period's price. This change may be positive, negative, or zero and is based on a combination of drift and randomness that is distributed normally with a mean of zero and a variance of dt. This makes sense intuitively, the larger dt (the change in time, or the time period) is the more spread out a collection of samples paths will be. To create a single sample path in the future we can simply create an instance of the
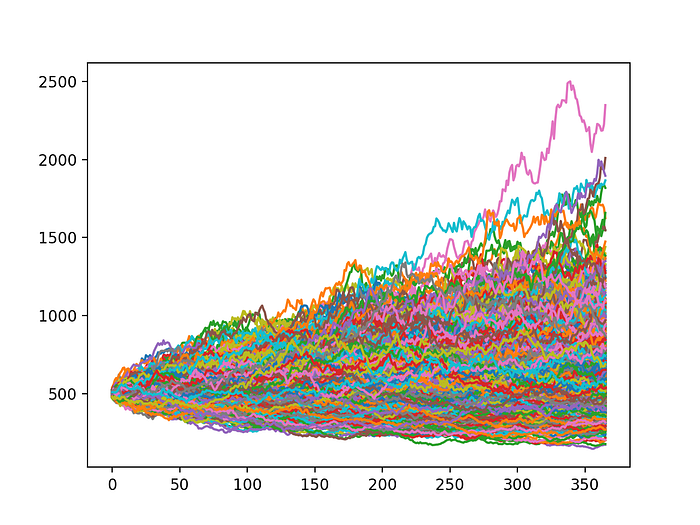
GBM class. However, if we wanted to generate multiple instances of sample paths (and plot it) that follow geometric Brownian motion we can write the following code…
Consequently, we generate 1000 sample paths for the asset based on our parameters which get nicely plotted using matplotlib…
Conclusion
By now you should have a firm grasp on geometric Brownian motion and its theoretical/practical applications. If you are interested in a live explanation with code you can check out the following video…
")