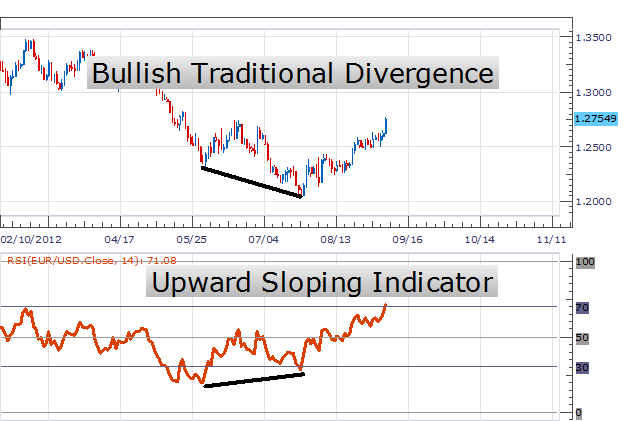
RSI went down as price went down. Where is the divergence?
look at some of the links on the Failure Swing Pattern. If it isn't clear from that, repost your observations...
hell, that post doesn't work. hard to find good help ain't it? lol
let's try this...
-
look at the price closes for the bars occuring around 8:08 and that 9:30ish hammer candle.
Then look at the wrsi indicator troughs for those same candles.
Then anchor a 'ray' line drawing tool on those points.
Note the slope of the rays, the price ray slopes which way up or down? The wrsi ray slopes which way, up or down?
Do the slopes agree or do they diverge?
The horizontal line drawn on the highest peak between the anchor points for an upward diverging wrsi was breached where you see that elipse labeled 'Failure Swing'.
For my two cents, at this point that a trader can not necessarily enter a trade, but start to look for indications that the price is set to follow through on the divergence signal, but for me it is not a trigger to enter, it is a heads-up.
At that point, a trader could look at other timeframes, other indicators, price action, eg that hammer at Support down there at the bottom is one of my standard dealios, and it is screaming before the failure swing got a move on, be that as it may, we are here for the failswing so what the wrsi does after the elipse point there is a part of the indicator that my observation has yielded little but may lend food for thought to other traders, maybe not, ymmv.
Post back with your thoughts.
Here's one in the other direction...
mind you, i'm not sold on these, but they are in my toolbox.
maybe this link works...
https://elitetrader.com/et/threads/...st-right-here-baby.335635/page-5#post-4930245
https://elitetrader.com/et/threads/...st-right-here-baby.335635/page-6#post-4934346