You are using an out of date browser. It may not display this or other websites correctly.
You should upgrade or use an alternative browser.
You should upgrade or use an alternative browser.
Real Reasons Behind Market Patterns
- Thread starter cornix
- Start date
The OP said he is an academic. As such he wishes to know why, he says.
This thread is rolling along mostly on the basis of PA. Certainly money is made through price action by trading on a platform connected to the market.
The mental part of trading comes from the acquisition of knowledge and skills. K and S form inference.
Inference is 90% of PERCEPTION.
REDNECK EXPLAINS HE DOES not TRADE INTRADAY AND ONLY TRADES INTER DAY. His K and S has formed an inference that works for his preferred domain.
Lastly, take a look at who trades entry/exit. I certainly do not. My K and S would not allow for such.
I'm a hold/reversal trader. Effectively I am in the market all the while and occasionally I exit/enter by doubling my market order compared to my position. I take the full offer of the market.
Only one market pattern exists to describe a market cycle. Granularity makes the market elements (what this thread calls "patterns") finite in number. My K and S includes each and every one of these.
For academics and those technically oriented, It is very important to follow the rules of the Algebra that you use. For example, the "why" of all market formations is the result of the independent variable dictating the result for the dependent variable.
VN can't answer the question: What is the independent variable of the market and how many elements are in its subset? The answers are volume and seven, respectively.
Earlier someone asked what has changed since 2000 when a book came out about market elements he called patterns. What changed, changed before 2000 and was not taken into account. Around 1970 RDBMS's came into being. This allowed for market elements to follow Orders Of Events (OOE's)
OOE's are what interlink (give a context as Redneck says) the items Bulkowski mentions.
Trading cycles are composed of opposite trends (2) and trends use variable OOE's to begin, form and end.
Any person can start with an open mind and in nine/ten months be making 1 million a day by beginning with one contract and a mind whose inference encompasses the 56 elements of the market system of operation.
notice the page is posting volume data primarily.what book is that page from?
i notice my question hasn't been answered. . par 4 the course here.notice the page is posting volume data primarily.
I think it is not a book, i find only few pages. Its some kind of scripts, I guess. Friend of my friend gave me some study materials and this and few more pages was included. It describes psychological models as driving force for markets. And few tips how to interpret order flow with focus to market makers behavior. I can put here next pages. Im not trading live yet. Just collecting information to decide what and how to trade. And I do not really understand the text..
Please do
RN
Whatever it was quoted from seems a bit presumptuous, don't you think? I am slightly interested though in the software that copies the DOM information like that. Guessing that is the close of bar DOM?
Whatever it was quoted from seems a bit presumptuous, don't you think?
I am slightly interested though in the software that copies the DOM information like that.
Guessing that is the close of bar DOM?
Well…, I don’t know – which is why I would like to read more
And here's what I don’t know
The write up;
M&M – does that stand for Market Maker.., the candy…, something else
IB – does that stand for Interactive Broker.., something else
Granted the hyperbole (write up in its entirety ) about who did what…, when…, for what reason.., and where one could take a target / set a stop loss – I ignored
===================
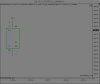
The chart
The two rows of numbers comprising the columns over the red/ green bars
Are the two rows aligned as Bid / Ask
Do the numbers represent shares / CARs/ ticks/ some other unit of measurement
Are the numbers DOM.., Tape (actual whatever units traded)…, something else
The negative number at the top…, highlighted in green – some sort of delta between the two rows of numbers…, some sort of weighting…, something else
Same for the positive numbers at the bottom…, highlighted in red
The two numbers with a rectangle around them.., within the columns of numbers – what does that signify
It is not the open/ close of that particular bar.., nor is it the highest number attained (of what ever those number represent) – in all cases
And eyeballing it – it does not appear to be an average
============
All I can say at this point;
I don’t know…, am curious…, and not hesitant in asking him to post the rest
Worst case..., he says no
Call me curious George
RN
Last edited:
Well…, I don’t know – which is why I would like to read more
And here's what I don’t know
The write up;
M&M – does that stand for Market Maker.., the candy…, something else
IB – does that stand for Interactive Broker.., something else
Granted the hyperbole (write up in its entirety ) about who did what…, when…, for what reason.., and where one could take a target / set a stop loss – I ignored
===================
The chart
The two rows of numbers comprising the columns over the red/ green bars
Are the two rows aligned as Bid / Ask
Do the numbers represent shares / CARs/ ticks/ some other unit of measurement
Are the numbers DOM.., Tape (actual whatever units traded)…, something else
The negative number at the top…, highlighted in green – some sort of delta between the two rows of numbers…, some sort of weighting…, something else
Same for the positive numbers at the bottom…, highlighted in red
The two numbers with a rectangle around them.., within the columns of numbers – what does that signify
It is not the open/ close of that particular bar.., nor is it the highest number attained (of what ever those number represent) – in all cases
And eyeballing it – it does not appear to be an average
============
All I can say at this point;
I don’t know…, am curious…, and not hesitant in asking him to post the rest
Worst case..., he says no
Call me curious George
RN
All of the text is SOP for those who "tape read" and have converted to using T&S and the DOM to "call" turns.
This is a rare example of using volume as a leading indicator of price. It also shows how add/deletes are more active market activities than the buy/sell activity.
The illustration is arranged as a Profile of a standard period of time intraday.
You can get the book it came from by using the chapter name at the bottom. The author is sharp and uses dry humor to make points.
good luck. I hope you tale up intraday trading soon.