Cornix, a good thread.
My perception is that with all the millions of traders and hundreds maybe thousands of stocks etc, there is no one answer as each stock or index behaves in a different manner. With the indexes we see often straight-ish trend lines, but with stocks especially the more speculative ones there is a high level of randomness. My impression is that stocks/indexes travel in more or less given direction until it gets to a point like a tight rope walker on a fence wire, but when she tires, a slight zephry breeze can tip her over either to the left or right.
My impression also is a large % of weak traders are copy catters who just follow direction while a small % of powerful traders have the control using pure, as it were, algo computer systems - they are not so much reading the news, they just trade according to what their algo dictates and their fire power allows them to influence direction.
In others words, pure systematic traders with very little emotion.
The large institutions as well I think have tools us bottom dweller swamp critters don't have. They see a picture we don't see as we lack the computer software technology. I jump to this conclusion based on the fact that in Australia it seems no co-incidence that the big 4 banks in Australia all own major brokerage houses catering for the retail trader and as well make gigantic profits year after year. Granted some of their large profits are derived from selling real-estate mortgages which is another lucrative business. I've always suspected the banks own the brokerages not so much for the fees they gain from trading but also because it allows them a window to access to data which is highly valuable to themselves, in afterwords I suspect a conflict of interest within the banks trading arms, but I can't prove it unfortunately.
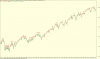
Anyhow attached is a EOD chart of the S&P500 going back a couple of years (only used this short time frame so you can read the chart details a bit more clearly).
These are buy and sell signals shown on the chart which are algo derived. It is a very simple concept, I designed this some years ago on Amibroker and it still works today.
All it is is a trailing stop loss of a set percentage. Every stock chart / indice will have a different % as every one is an individual, eg very speculative stocks will have very large % stop losses but also very speculative stocks often have such high levels of randomness they cannot be algo'd.
So in conclusion I'm trying to say that indexes in particular are primarily governed by support and resistance and trend lines, monitored by algo's.
Speculative stocks are also governed by the above, but as per the analogy of the tight rope walker, she is drunk and unpredictable largely, and monitored predominantly by discretionary wannabee millionaires sitting in their trailer in underwear.
Intraday trading, I cannot understand it too much - constantly lots of noise and randomness, while EOD is where I can see the logic of its behavior.
My perception is that with all the millions of traders and hundreds maybe thousands of stocks etc, there is no one answer as each stock or index behaves in a different manner. With the indexes we see often straight-ish trend lines, but with stocks especially the more speculative ones there is a high level of randomness. My impression is that stocks/indexes travel in more or less given direction until it gets to a point like a tight rope walker on a fence wire, but when she tires, a slight zephry breeze can tip her over either to the left or right.
My impression also is a large % of weak traders are copy catters who just follow direction while a small % of powerful traders have the control using pure, as it were, algo computer systems - they are not so much reading the news, they just trade according to what their algo dictates and their fire power allows them to influence direction.
In others words, pure systematic traders with very little emotion.
The large institutions as well I think have tools us bottom dweller swamp critters don't have. They see a picture we don't see as we lack the computer software technology. I jump to this conclusion based on the fact that in Australia it seems no co-incidence that the big 4 banks in Australia all own major brokerage houses catering for the retail trader and as well make gigantic profits year after year. Granted some of their large profits are derived from selling real-estate mortgages which is another lucrative business. I've always suspected the banks own the brokerages not so much for the fees they gain from trading but also because it allows them a window to access to data which is highly valuable to themselves, in afterwords I suspect a conflict of interest within the banks trading arms, but I can't prove it unfortunately.
Anyhow attached is a EOD chart of the S&P500 going back a couple of years (only used this short time frame so you can read the chart details a bit more clearly).
These are buy and sell signals shown on the chart which are algo derived. It is a very simple concept, I designed this some years ago on Amibroker and it still works today.
All it is is a trailing stop loss of a set percentage. Every stock chart / indice will have a different % as every one is an individual, eg very speculative stocks will have very large % stop losses but also very speculative stocks often have such high levels of randomness they cannot be algo'd.
So in conclusion I'm trying to say that indexes in particular are primarily governed by support and resistance and trend lines, monitored by algo's.
Speculative stocks are also governed by the above, but as per the analogy of the tight rope walker, she is drunk and unpredictable largely, and monitored predominantly by discretionary wannabee millionaires sitting in their trailer in underwear.
Intraday trading, I cannot understand it too much - constantly lots of noise and randomness, while EOD is where I can see the logic of its behavior.
Attachments
Last edited:
")