
Real or BS?

I am studying my way up the learning curve on options and this graph showed up in my inbox advertised as a 'leveraged calendar spread' ... send-me-money-for-training.

upload_2021-2-25_17-6-37.png

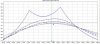
Seems wildly better than the typical calendar graphs I have looked at previously.

upload_2021-2-25_22-53-10.png

Could the play in the first graph be reasonably constructed and I am too jaded?

If so, I am game and humble enough to learn. What would the legs look like?

All comments appreciated!!!
 

Attachments

  • DoubleCalendar.jpg
    DoubleCalendar.jpg
    60.6 KB · Views: 12
I am studying my way up the learning curve on options and this graph showed up in my inbox advertised as a 'leveraged calendar spread' ... send-me-money-for-training.
...

What does your gut tell you? Listen to it, and...

Caveat emptor.
 
@Trader200K , the second chart in your post is a double calendar, so cannot be compared to the first.

So someone sent you the first chart and is asking for money if you want to know how to construct something like that? Well, that chart looks similar to a diagonal to me. It's very easy to create that sort of a risk/reward profile whereby the trade is set up as a credit (hence no risk on the down-side) but there is a corresponding larger risk to the upside - see how the loss is quite large at 394, and I bet it gets even larger as the stock price goes to 400 and above. Nothing magical about this set-up at all. If you want to know how to set up a diagonal, just send-me-money-for-training :-)
 
Hear you. My gut is why I haven't spent the money on da "training". But I am hooked on the maso-what-if thing because a few times I found that the impossible just took a bit longer.

I'd be happy if one of my betters could confirm that this curve really is impossible to the casual non-knuckledragger options trader who simply knows 'fact X' and 'fact Y'. o_O
 
The first graph is 100% real, I've traded a few. Most result in a small profit or small loss.

The trick is in finding the stock that will create that sort of return.
 
I am studying my way up the learning curve on options and this graph showed up in my inbox advertised as a 'leveraged calendar spread' ... send-me-money-for-training.

View attachment 253138
Seems wildly better than the typical calendar graphs I have looked at previously.

View attachment 253177
Could the play in the first graph be reasonably constructed and I am too jaded?

If so, I am game and humble enough to learn. What would the legs look like?

All comments appreciated!!!

it wasnt difficult it is a diagonal spread with a credit that remove 1 side of the risk

the nice one is here


same trade but the ugly side
 
@Trader200K , the second chart in your post is a double calendar, so cannot be compared to the first.

So someone sent you the first chart and is asking for money if you want to know how to construct something like that? Well, that chart looks similar to a diagonal to me. It's very easy to create that sort of a risk/reward profile whereby the trade is set up as a credit (hence no risk on the down-side) but there is a corresponding larger risk to the upside - see how the loss is quite large at 394, and I bet it gets even larger as the stock price goes to 400 and above. Nothing magical about this set-up at all. If you want to know how to set up a diagonal, just send-me-money-for-training :)
Can we get the first chart if we move both calendars to the right?
 
The first graph is 100% real, I've traded a few. Most result in a small profit or small loss.

The trick is in finding the stock that will create that sort of return.

Great! Thank you! This gets me into the zone. :)
 
it wasnt difficult it is a diagonal spread with a credit that remove 1 side of the risk

the nice one is here


same trade but the ugly side

AH! Now that is far more believable curve and lowers the BS meter appreciably. Great.

I did notice that the first graph has breakpoints at $388 and $390. That seems to hint that there might be a third instrument in there that might broaden the profit zone. Will have to experiment a bit more to see if that dog hunts. Thanks for your great help!!! :D
 
@Trader200K , the second chart in your post is a double calendar, so cannot be compared to the first.

So someone sent you the first chart and is asking for money if you want to know how to construct something like that? Well, that chart looks similar to a diagonal to me. It's very easy to create that sort of a risk/reward profile whereby the trade is set up as a credit (hence no risk on the down-side) but there is a corresponding larger risk to the upside - see how the loss is quite large at 394, and I bet it gets even larger as the stock price goes to 400 and above. Nothing magical about this set-up at all. If you want to know how to set up a diagonal, just send-me-money-for-training :)

I missed the risk imbalance entirely (and hadn't heard of a Double Calendar).
Great point/deeper rabbit hole.

I do need to get less jaded on training from my betters :thumbsup::p
 
Back
Top