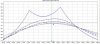
I am studying my way up the learning curve on options and this graph showed up in my inbox advertised as a 'leveraged calendar spread' ... send-me-money-for-training.

Seems wildly better than the typical calendar graphs I have looked at previously.

Could the play in the first graph be reasonably constructed and I am too jaded?
If so, I am game and humble enough to learn. What would the legs look like?
All comments appreciated!!!
Seems wildly better than the typical calendar graphs I have looked at previously.
Could the play in the first graph be reasonably constructed and I am too jaded?
If so, I am game and humble enough to learn. What would the legs look like?
All comments appreciated!!!