You are using an out of date browser. It may not display this or other websites correctly.
You should upgrade or use an alternative browser.
You should upgrade or use an alternative browser.
Perfect Wave - 2012-1/2
- Thread starter snowrider
- Start date
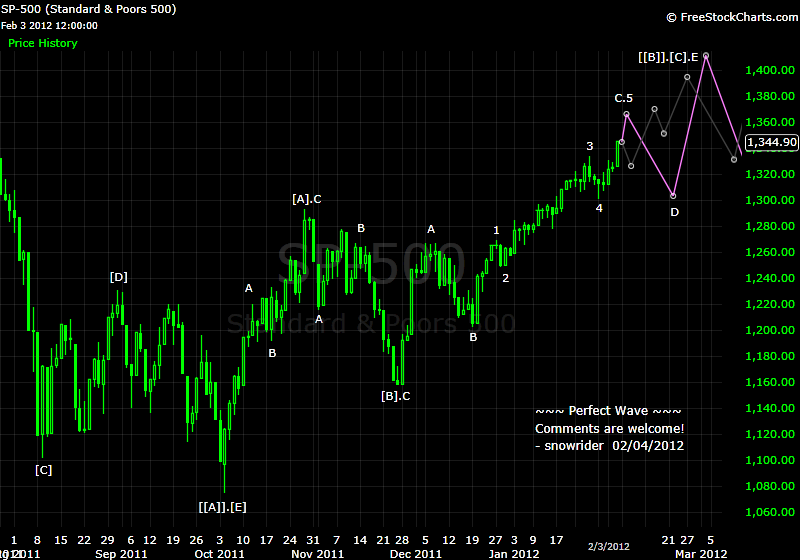
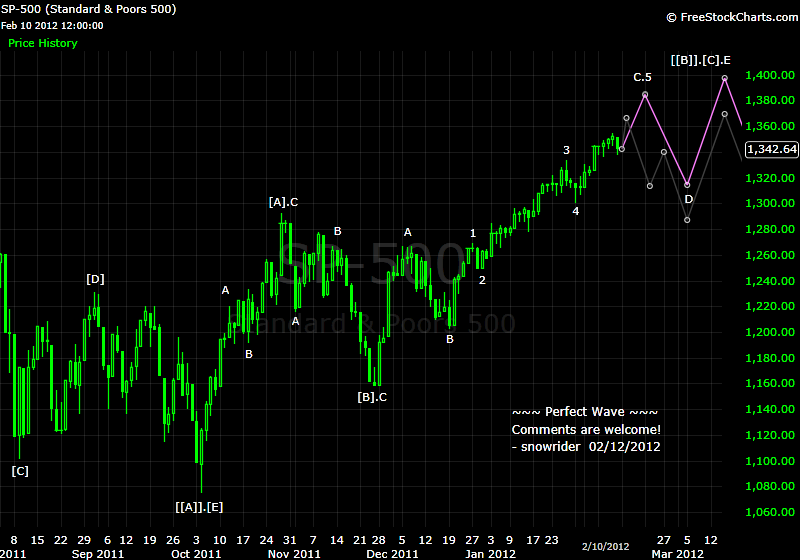
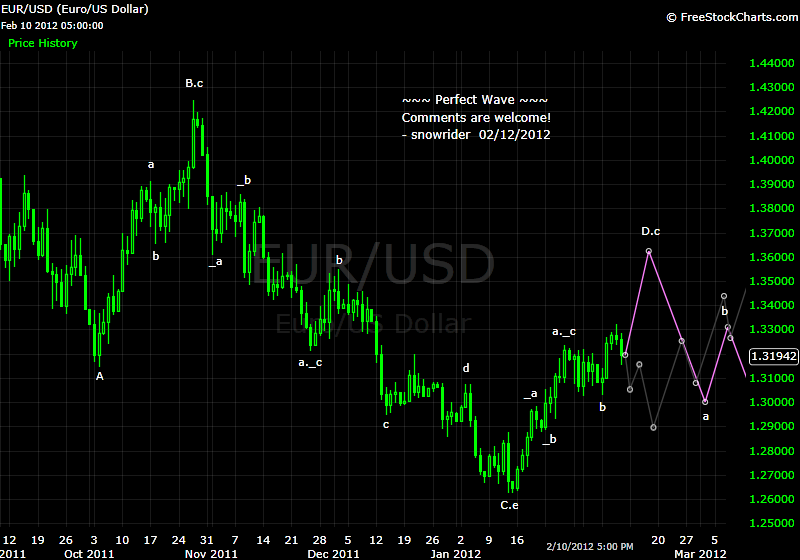
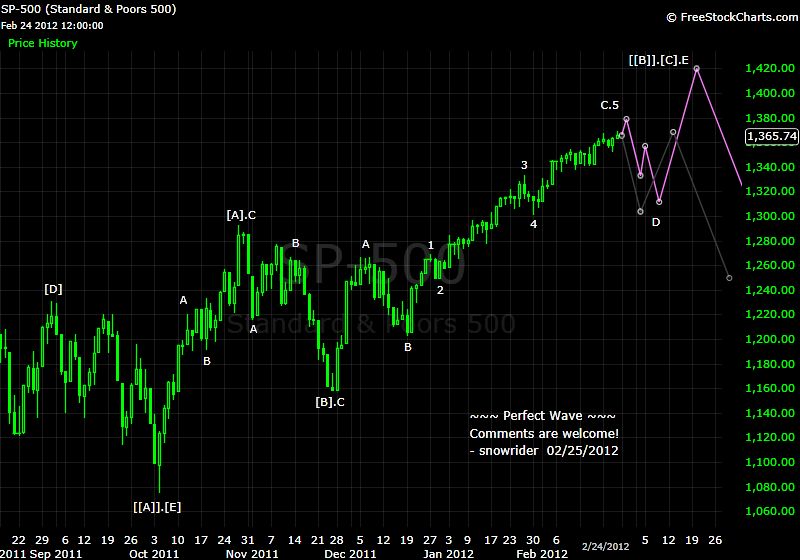
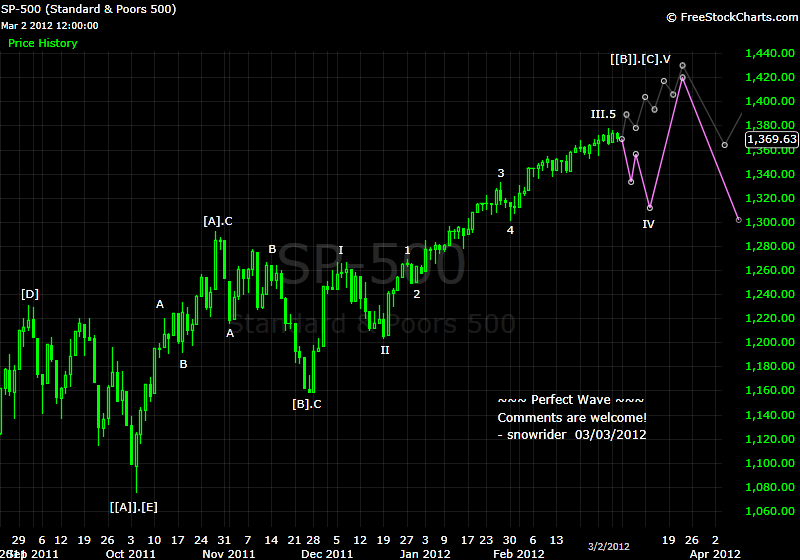
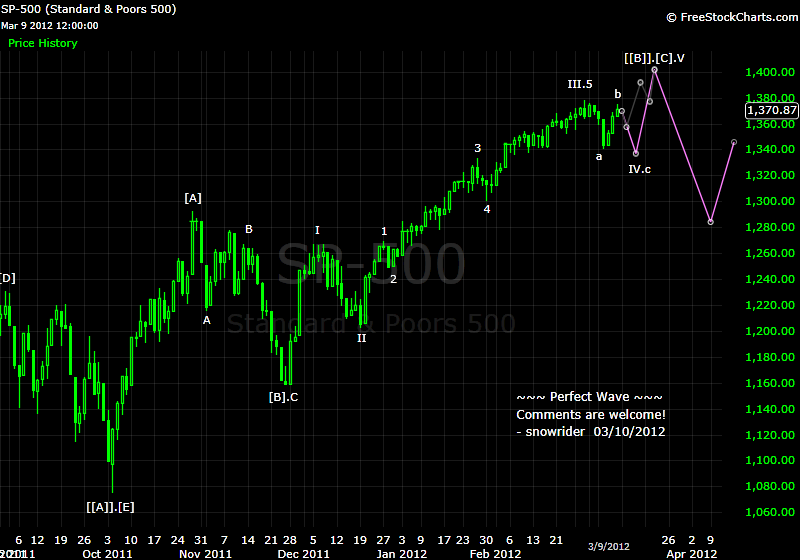
1) if SPX goes to 1370 first before C5 formed, the C5 will equal C3, or may be great than C3, right ? but we know C5 can't be great than C3 according Wave Theory. How can we explain this?
C.3 = 84 (1333-1249)
C.5 could be: 1300+84=1384 if C.3=C.5
C.5 could be longer than C.3 (as long as C.3 is not the shortest was in C)
2) If C5 is really formed at 1370, the Fib 61.5% pull back target should be great than 50 point, right ?
If C.5 ends at around 1384, the ideal correction target for C is where the previous 4 ends (C.4, i.e., 1300 area)
3) how can we draw the a-b-c waves after C5 (It's not indicated in the chart ??) I mean wave 'b' is great than C5 <-- Does it mean 'extend' wave instead of a-b-c waves (purple lines) ?
The ending of C.5 is the ending of wave-C. After that a wave-D could be formed. We don't know if wave-D will be in regular or irregular correction form until we see the market's behavior.
I'm a big fan of Elliot wave theory and harmonic trading, however you way over complicate the labeling which deters me (and probably others) from following along. Simply stating the pair and TF (in post) with wave counts 1,2,3,4 a,b,c,d and sub waves as 1a, 1b, 1c, 1d ect works just fine. This, of course, is just my opinion, in the whole scheme of things, it doesn't make much difference.
Big ups for the thread though not many people keep up with these sort of threads. So even if you don't conform to my way of thinking do keep posting charts others will surely find it helpful or at the vary least interesting.
johnny2pips - Thanks for commenting and the suggestion. Please take a look the very first post of this thread, and it will give us an idea about the convention of my wave labeling. It is actually much easier to read and much less confusing than that of most famous EW techinicians. Yes, I agree that "it doesn't make much difference" on different labeling ways because we EW techinicians speak the same language - impulsive vs corrective waves.
Quote from snowrider:
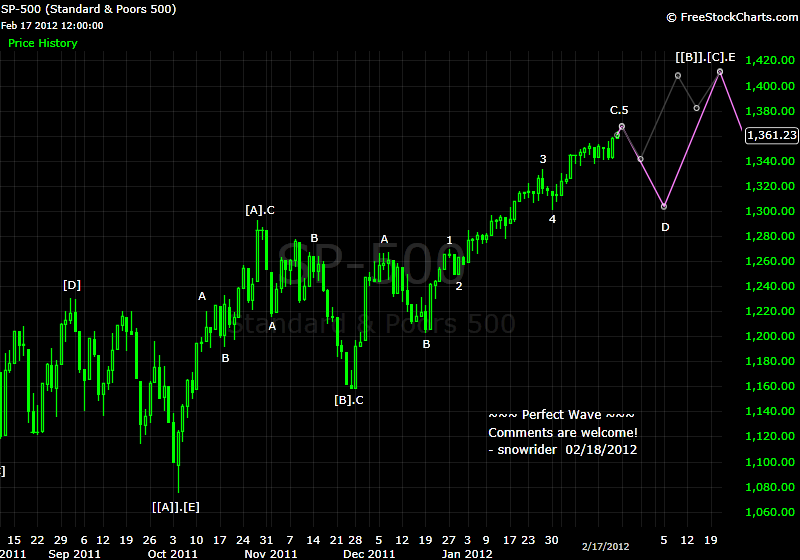
Rothschild - I would guess that SP spot index 1320 area could be where the reversal starts. We need to pay attention if SP ever moves to that area to see if there is any sign of exhaustion.
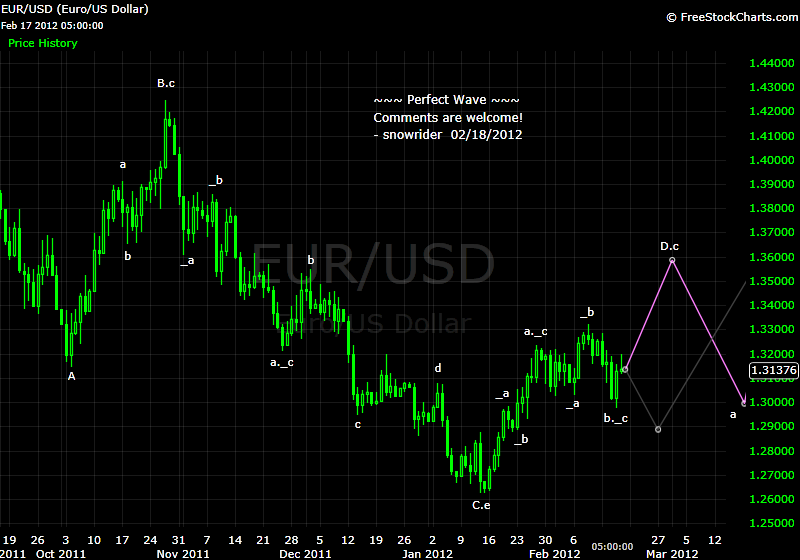
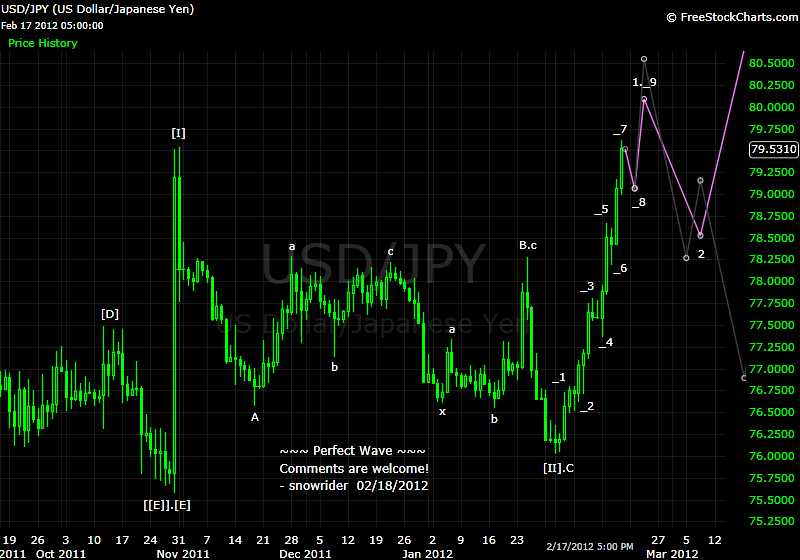
So you see that 1320 did not show any sign of climax or exhaustion ... and I have been updating the wave count every weekend. Now here is just my guess that a big correction is going to start this week.
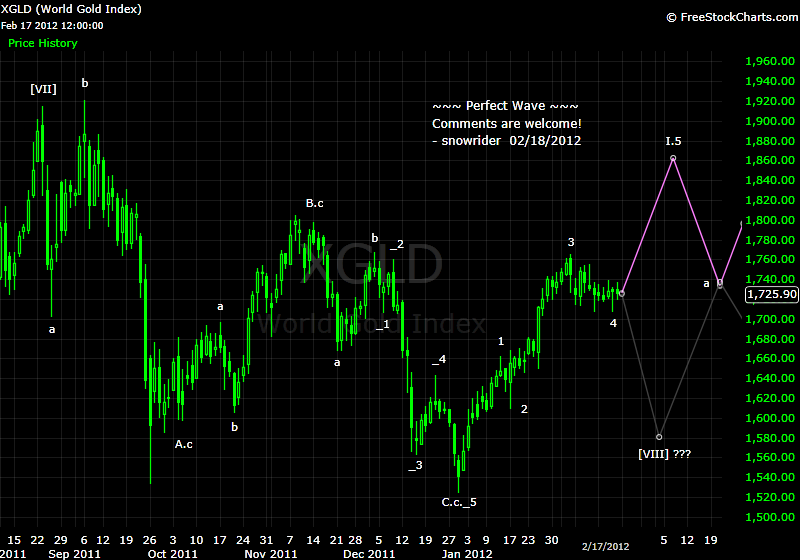
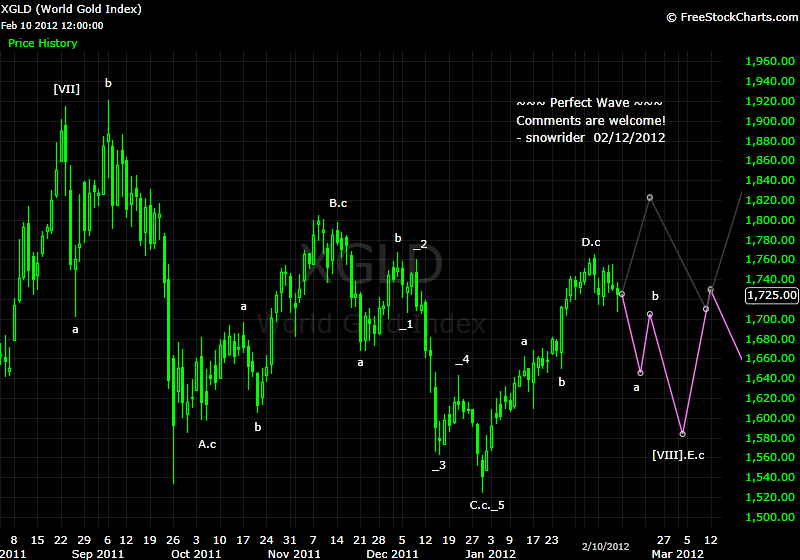
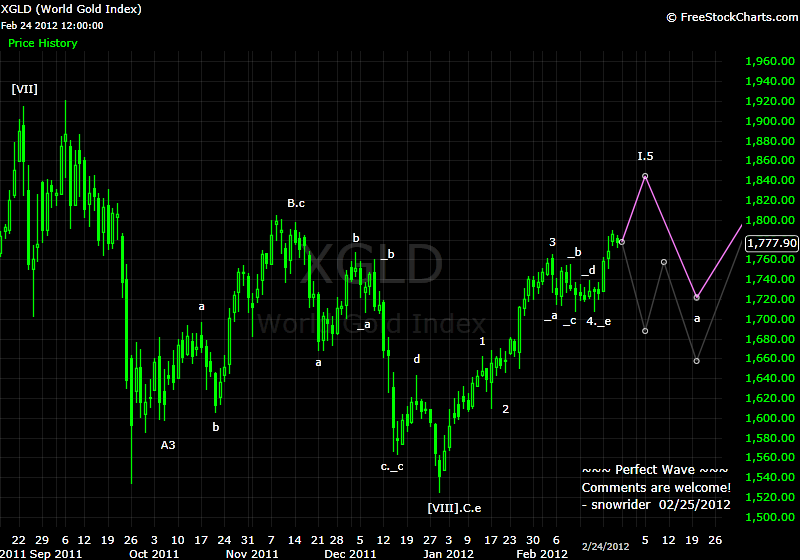
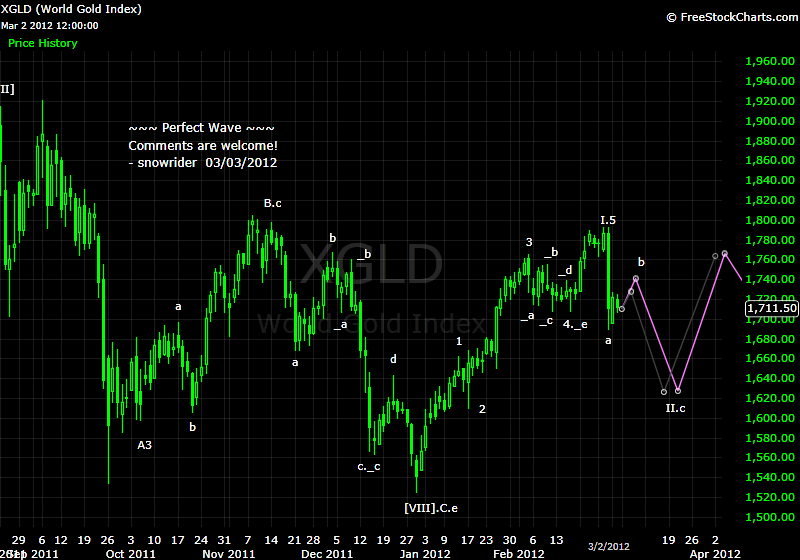
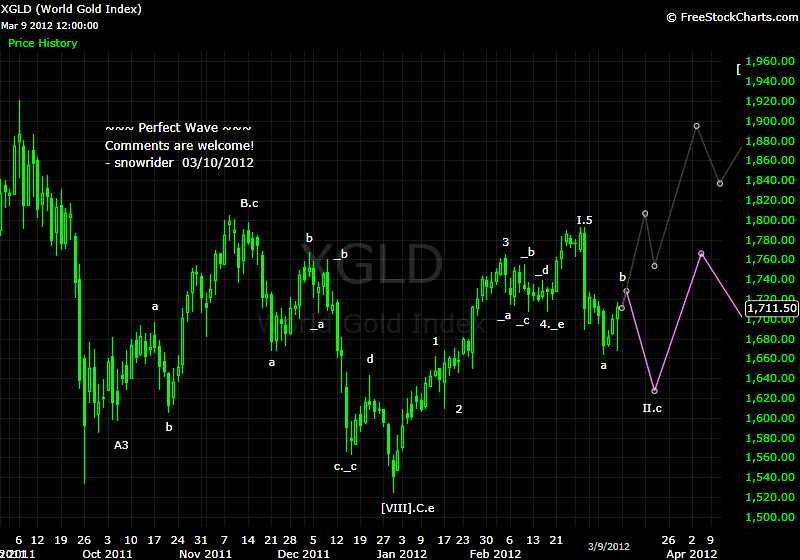
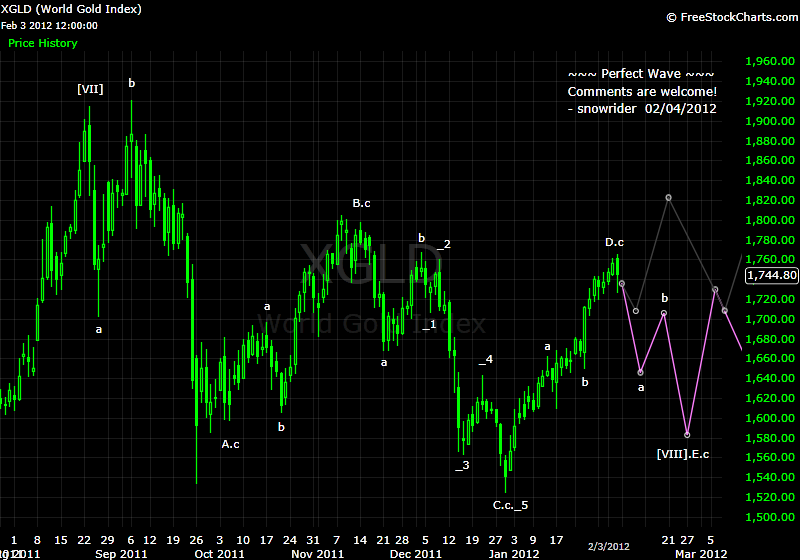
for gold, you're saying we're in a triangle, with the E wave having started lower. However, the triangle connecting ABCDE you show is neither descending, ascending, or symmetrical. Am I missing something?
nim1984 - Thanks for commenting. The wave-E scenario was based on the assumption that wave-D must be in a 3-segment movement. Today's price action shows that the purple line scenario is more possible because our previous wave-D has become a 5-segment wave which means that it is not a wave-D any longer. Talking about a triangle, it does not need to be perfectly descending, ascending, nor symmetrical, as long as it is a triangle. Hope this help.