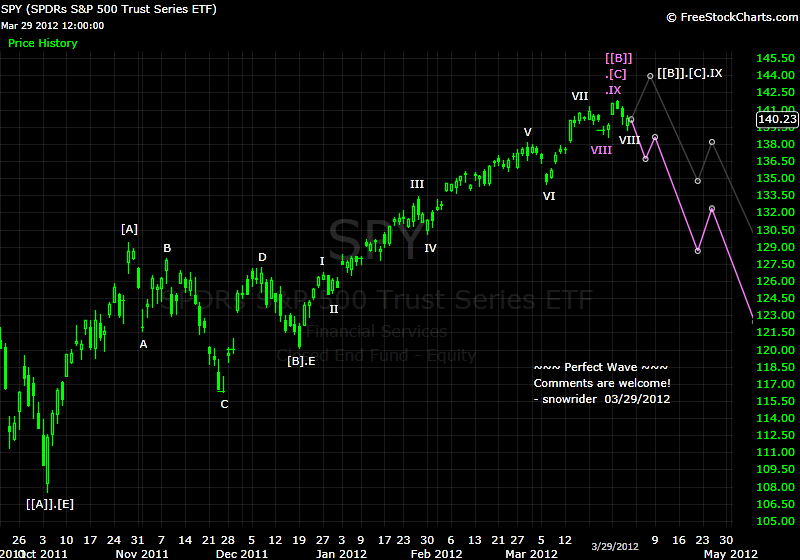
Perfect Wave - 2012-1/2

Quote from snowrider:

bwolinsky - I have extensively played system long time ago, I wrote tons of systems with TradeStation, I did backtesting 24x7, and then I threw all my systems to trash can. What I want to tell you about backtest is ... been there and done that. If you are asking some trader who utilizes price action and/or pattern methodologies (e.g., Gann, Elliott Wave, Dow Theory etc.) about back testing, you ask a wrong question!

I post my wave analysis here not looking for followers. I am looking for people who speak the same langauage (are also playing EW) for discussion. I am looking for people who enjoy playing EW on trading like playing chess. If you don't believe in EW, you won't be interested in reading my posts.

Apparently the scientific method is not your forte.

Elliott Wave has been found to be impossible to backtest, so rather than claim your strategies come from EW, it's more that even you don't understand the rules because there aren't any.

You place levels of your trades into a pattern, if it goes here, but not above there then it's one of the markers, but as far as that being predictive, it has been shown to be utterly useless, and until I've seen strategies with backtests based on the method, it will continue to be mindless garbage.

Don't you at least want to know the probabilities of trading using these methods? It seems you're into posting charts, rather than trading. Since you are familiar with tradestation get reacquainted with easylanguage by working from multicharts for awhile, then come back when you've done the work to determine if one of the markers is more likely to happen after another mark was reached, add some logic, then tell us how it does.

I have a lot against EW because it cannot be backtested, and this is a fault so obvious to me I'm always amazed at the poster's lack of incredulity when there is no backtest I would call robust using those so-called "methods." Gann, Elliott Wave, Dow Theory all fall into a category of belief system, not to be used to trade based on any prediction it might make, and only until there are rules for these methods will it ever prove that there is anything profitable about them.
 
Quote from bwolinsky:

What has your backtest showed and what have your results been?

It's apparent some logic's went into the chart drawings, but none placed on any performance summaries or analysis of the data.

Reminds me of Hershyites, must draw straight lines, without questioning whether they actually did go to where they ended when they were drawn or any regard to what actually happened later.

This thread is missing that analysis, and it's required if you expect anyone to really analyze the charts that have been posted.

EW is very difficult to back test because programming a pivot requires some critical parameter selection (days back / forward being the first I can think of). From these pivots comes the trend lines, etc. I still haven't figured out how to do it. :)

A simpler way would be to simply back test your trend following trigger and note from the forward test when it coincided with the various waves, although this creates a danger of counting the waves in hindsight.

The only way, IMO, is to check an EW practitioner's account statement.

:D
 
Quote from Wide Tailz:


The only way, IMO, is to check an EW practitioner's account statement.

:D

So true, but remember your hourly bars lag the reversal significantly.
 
Quote from bwolinsky:


I have a lot against EW because it cannot be backtested, and this is a fault so obvious to me I'm always amazed at the poster's lack of incredulity when there is no backtest I would call robust using those so-called "methods." Gann, Elliott Wave, Dow Theory all fall into a category of belief system, not to be used to trade based on any prediction it might make, and only until there are rules for these methods will it ever prove that there is anything profitable about them.

For similar reasons, I have a lot against fundamental analysis.

EW fits into my trend following system by filtering the buy signals by wave type. My be$t trades, by far, have been during a third wave (either the general market or the stock itself).

Wave 3 is the first higher low and breaks the previous trend line, and typically follows noticeable divergence in MACD, RSI, money flow, Stochastics, ROC, and any other momentum indicator. A huge candle as the dam breaks is the final confirmation.

OP: my comment for your analysis is that I'm amazed how far you take the corrective wave counts. I've never had much success trying to analyze them. I see the SP500 currently in a B wave completing the C wave of next lower degree, itself seeing wave 5 of next lower degree completing as I type.....

:D
 
Quote from bwolinsky:

So true, but remember your hourly bars lag the reversal significantly.

I'm willing to give up a substantial part of the move for a better confirmation that it is actually happening.

:)
 
Hi snowrider some great posts on EW well done, some interesting points mapped out in the S&P.... I just have a question... is there any distinction on grey/purple trend lines? i.e one more probable than the other

BoyTrader - Thanks for nice words. The purple lines are my preferred wave counts, while the grey ones are the alternative counts. Of course there are numerous possible wave counts out there, and different people have different preferred counts. I trade to the direction of the purple line. Once the market reaches some point where the purple line becomes invalid, the grey line takes over and becomes the preferred one.
 
Quote from Wide Tailz:

For similar reasons, I have a lot against fundamental analysis.

EW fits into my trend following system by filtering the buy signals by wave type. My be$t trades, by far, have been during a third wave (either the general market or the stock itself).

Wave 3 is the first higher low and breaks the previous trend line, and typically follows noticeable divergence in MACD, RSI, money flow, Stochastics, ROC, and any other momentum indicator. A huge candle as the dam breaks is the final confirmation.

OP: my comment for your analysis is that I'm amazed how far you take the corrective wave counts. I've never had much success trying to analyze them. I see the SP500 currently in a B wave completing the C wave of next lower degree, itself seeing wave 5 of next lower degree completing as I type.....

:D

Wide Tailz - Thanks for commenting. Believe it or not, I don't give a shxt on any fundamental analysis. Ironically, I used to be doing and writting a lot of fundamental analysis, and I knew that it was just like writing some stories because people wanted to read stories.

I strongly agree with you that the best and easist trades are on the wave-3. About the question how I "take the corrective wave counts", I start from the highest possible degree of timeframe (e.g., montly chart) to analyze and then scale down to the tradeable timeframe (e.g., daily chart). Therefore, sometime a corrective wave in a monthly chart still has some impulsive wave in the daily chart which we can make money from. :)
 
03/29/2012

Comments are welcome!

133716d1333067949-perfect-wave-2012-1-2-20120329-sp-daily.png
 
Quote from jas_in_hbca:

Hey Snowrider,

I'm counting it different but same result. Should be turning lower.


thanks for your posts !

jas_in_hbca - thanks for posting. That is similar to my original weekly wave count. I just posted an alternative count.
 
Back
Top