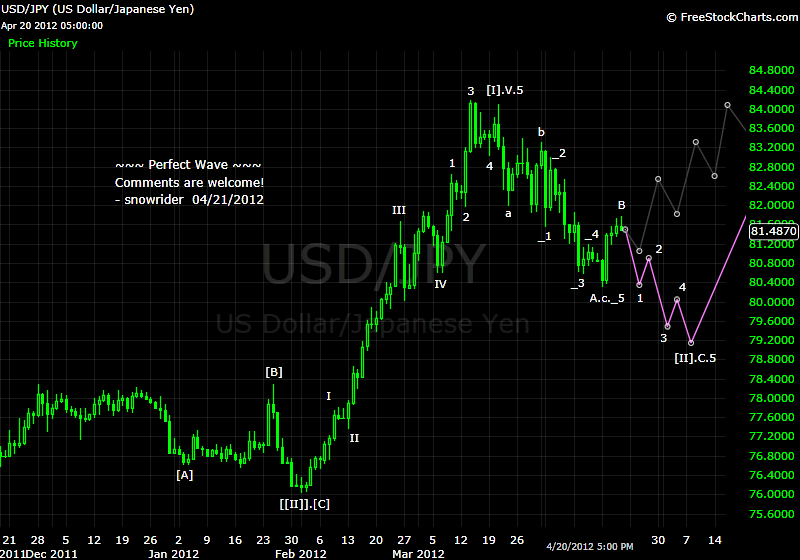
Perfect Wave - 2012-1/2

Quote from toc:

Snowrider,

given that you have been doing the EW for sometime now, what percentage of your calls prove to be good. have never been into EW although use Fib retracements etc. at times.

toc - The successful rate of my purple lines (preferred counts) is about 50% (half-half), so it is nothing special and nothing significant by simply following my purple lines. However, the good thing and advantage of using EW for trading because it provides some strict rules so that we know where to go and where to stop once our preferred counts are wrong.
 
snowrider,

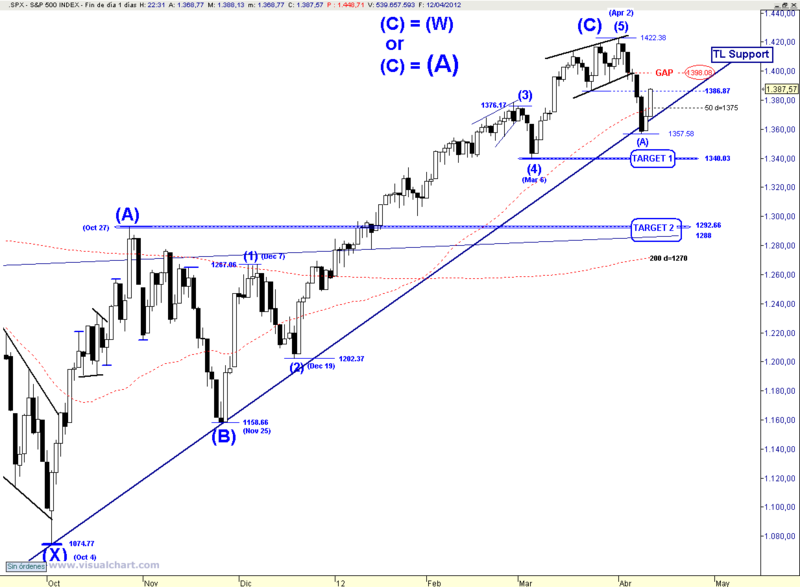
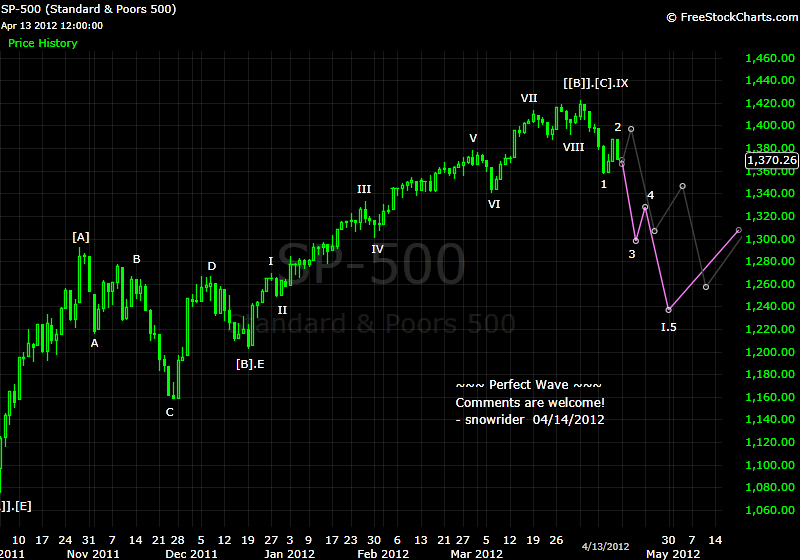
Given the recent swings in SPX, is it safe to interpret the past five down bars as "A" and today's snap back rally as "B" of Wave 4, which may last a few more days, followed by a "C" wave back down? The way I read the current pattern, the SPX falls below its current 50 day moving average of 1,370 again, thus completing the A-B-C pattern in Wave 4.

However, I find the difficulty in EW analysis is in attempting to pinpoint the accuracy of when Wave 4 ends and when Wave 5 begins, until of course after the fact!
 
Quote from ScalperJoe:

snowrider,

Given the recent swings in SPX, is it safe to interpret the past five down bars as "A" and today's snap back rally as "B" of Wave 4, which may last a few more days, followed by a "C" wave back down? The way I read the current pattern, the SPX falls below its current 50 day moving average of 1,370 again, thus completing the A-B-C pattern in Wave 4.

However, I find the difficulty in EW analysis is in attempting to pinpoint the accuracy of when Wave 4 ends and when Wave 5 begins, until of course after the fact!

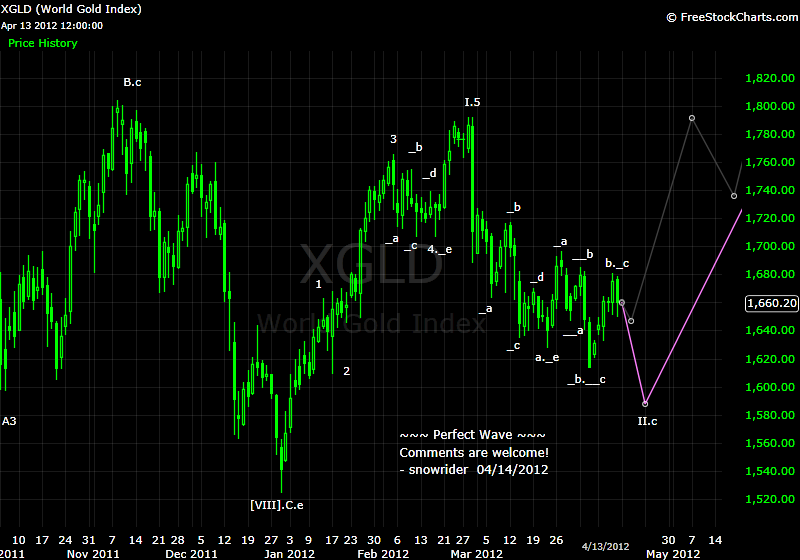
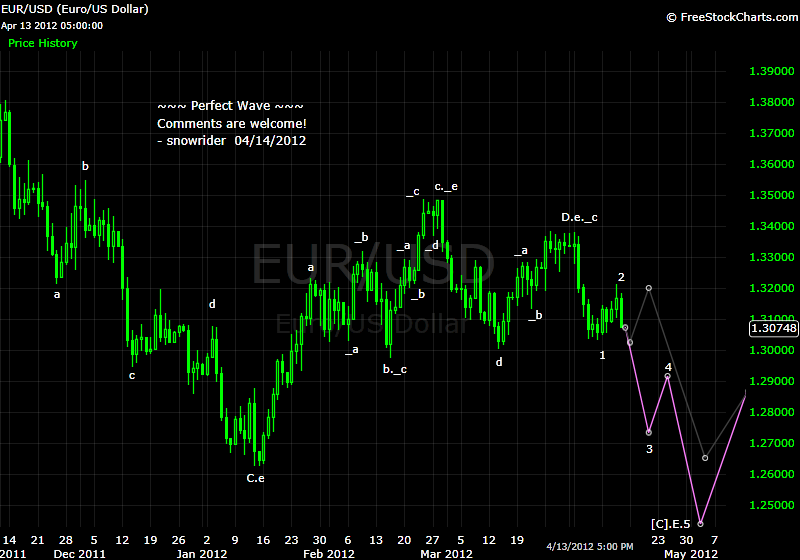
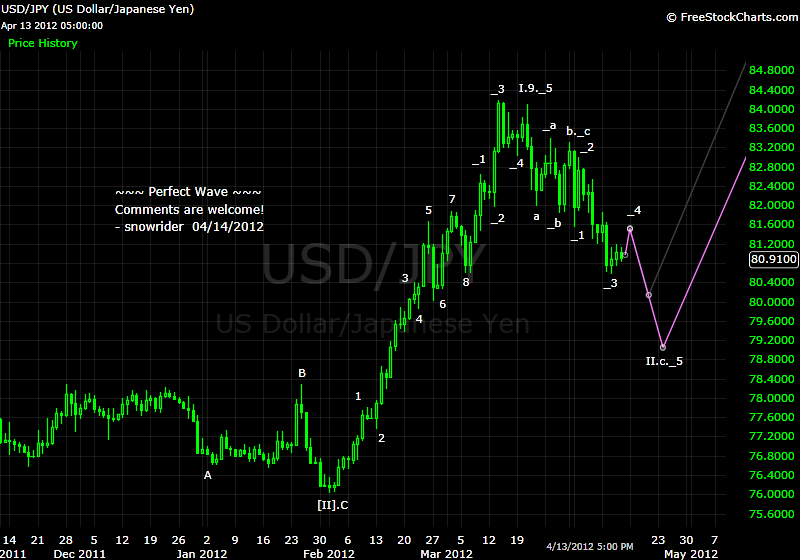
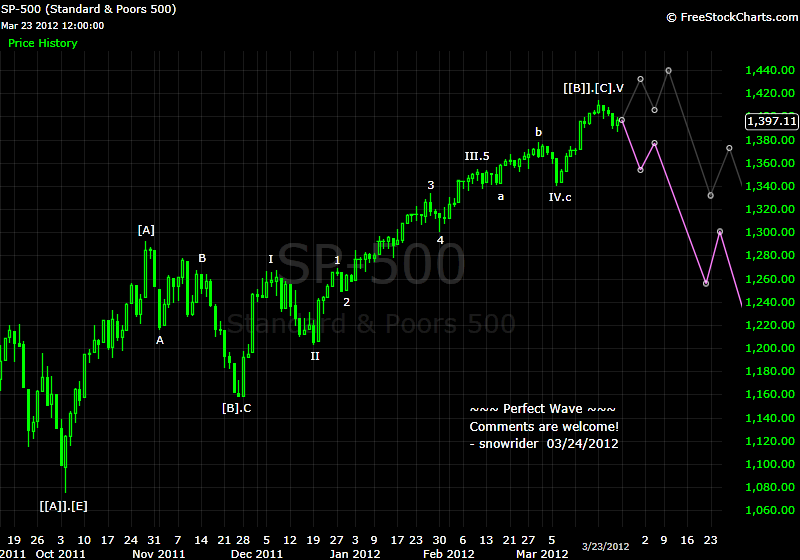
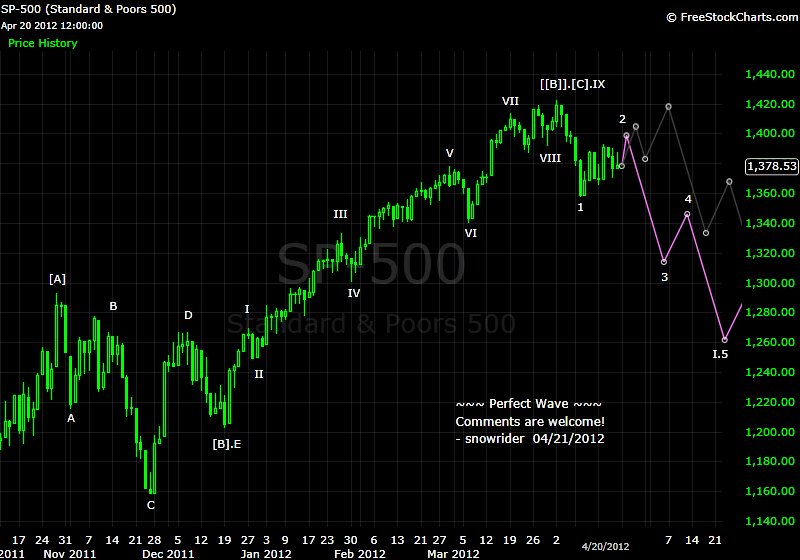
ScalperJoe - Yes, that is a way of counting this if we predict that the downward movement is in ABC mode. Another way of counting this is to treat the 5 down bars as wave 1 of the downward movement, so we just about finishing wave 2. There are many other ways of counting this. My trading philosophy is trying to lay out as many possible counts as I can, and then watch those critical area to see if there is any reversal sign (in order to confirm which count is more likely and to trade).
 
04/14/2012

Comments are welcome!

134802d1334463382-perfect-wave-2012-1-2-20120414-sp-daily.png


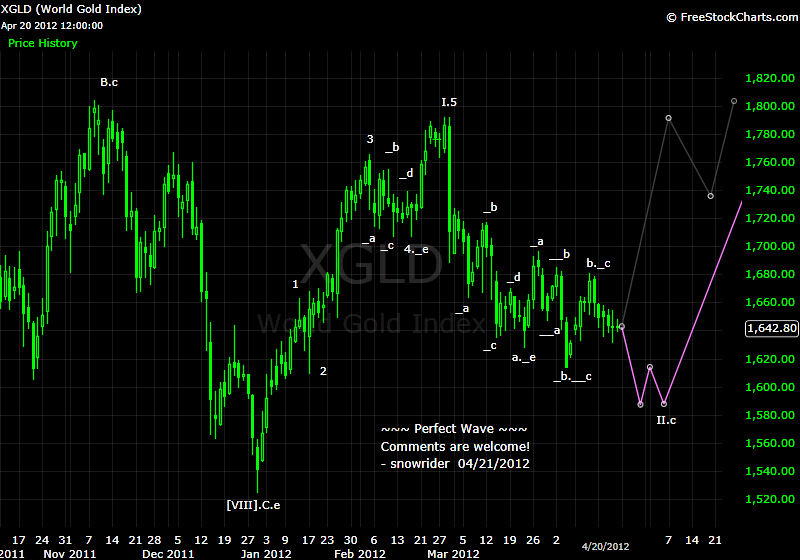
134806d1334463382-perfect-wave-2012-1-2-20120414-gold-daily.png


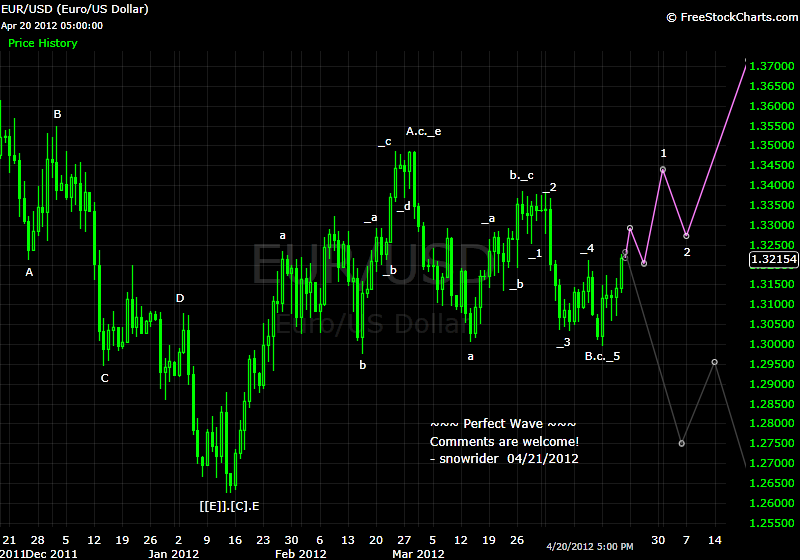
134808d1334463382-perfect-wave-2012-1-2-20120414-eur-daily.png


134804d1334463382-perfect-wave-2012-1-2-20120414-jpy-daily.png
 
Quote from EliteThink:

the odds of that occuring in an election year for the spx are low. 1325-1340 should be solid support.

EliteThink - Thanks for sharing your thought!
 
snowrider,
the count of the "thewavetrading" since the oct. 2011 low for the S&P is more logic for me than yours:

http://imageshack.us/photo/my-images/51/ewsp124.png/
Sixer

Sixer - Thanks for sharing your thought! Yes, yours is a valid and good count. I have had similar count before changing to the current one. If we count that way, the wave-IV (your (4) wave) could also be counted as a flat. See the following old post:

133258d1332630014-perfect-wave-2012-1-2-20120324-sp-daily.png


And your count:
134850d1334543495-perfect-wave-2012-1-2-ewsp124.png
 
Back
Top