Quote from bsmith72:
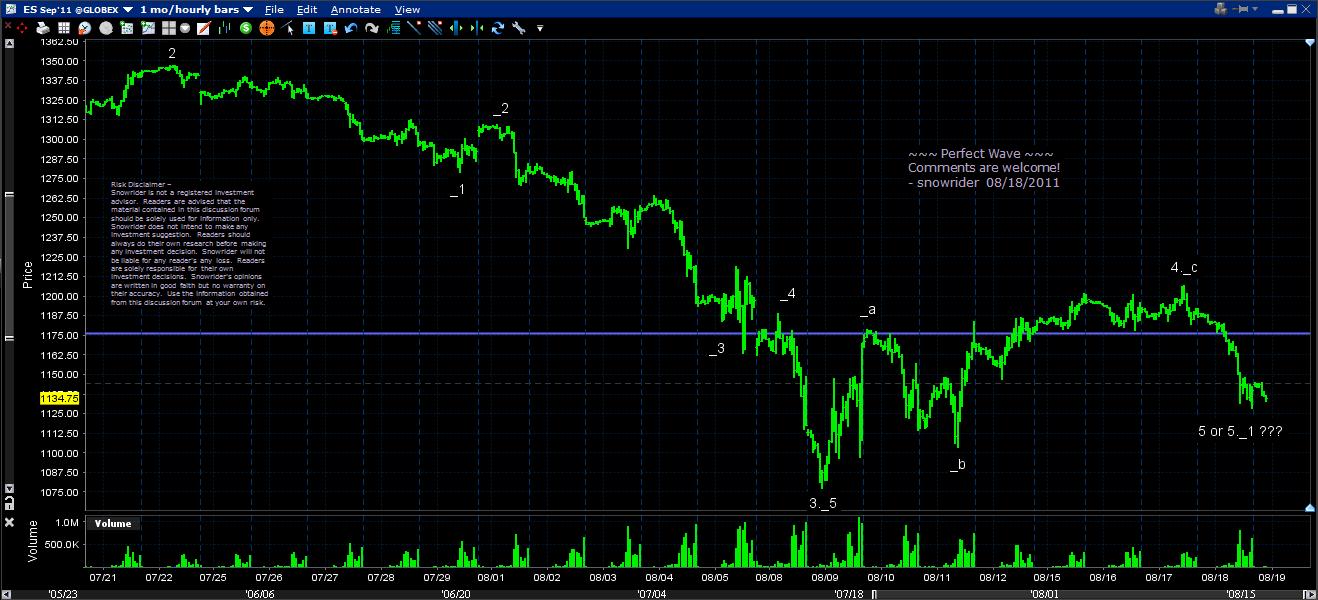
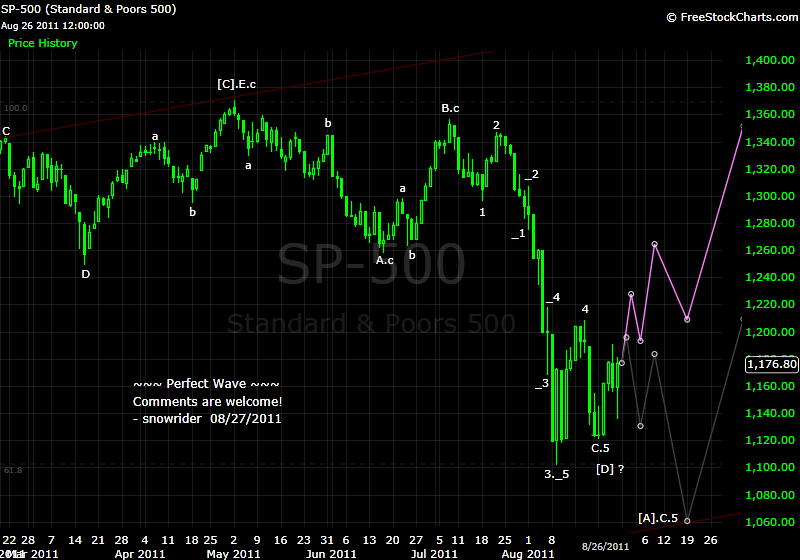
And here's my S&P 500 4 hour chart from Aug 10.
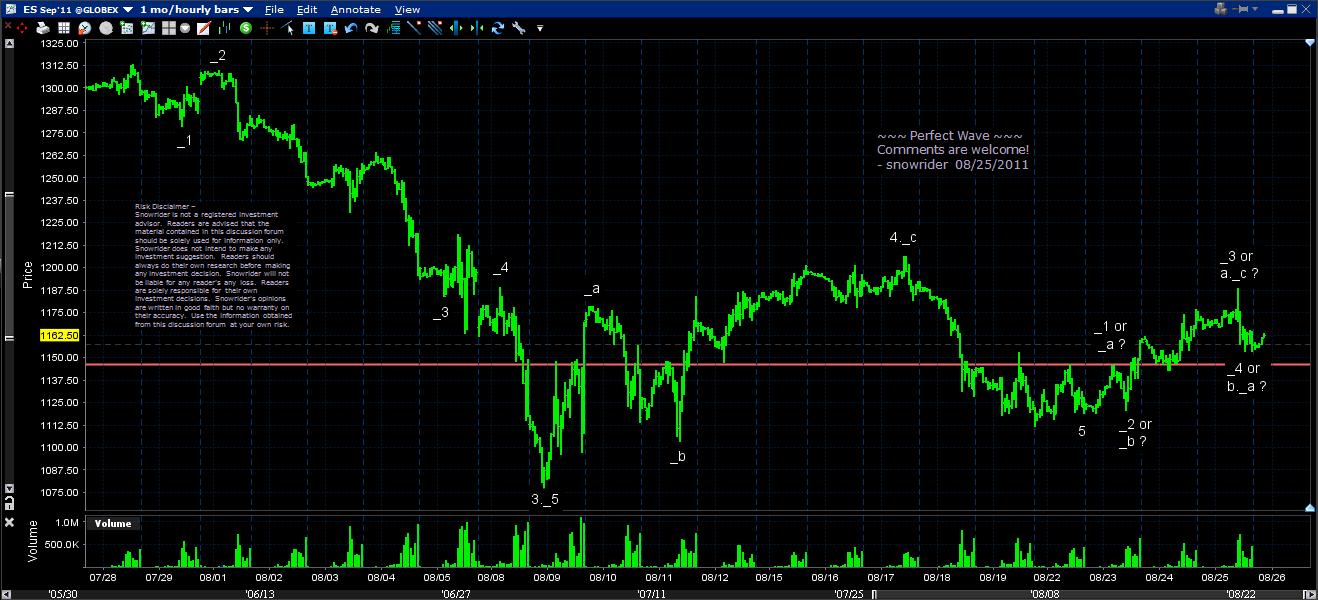
bsmith72 - Thanks for posting your wave counts. I see both of your charts. My intraday count is very similar to yours with slight difference. In the 4h timeframe, the following is my count vs yours:
My Yours
---- --------
1 (i)
2 (ii)
_1 (1)
_2 (2)
_3 iii
_4 iv (actually my _4 label is at the end of triangle)
3._5 (iii)
4 (iv) - This is where we are at now (the end of this correction)