You are using an out of date browser. It may not display this or other websites correctly.
You should upgrade or use an alternative browser.
You should upgrade or use an alternative browser.
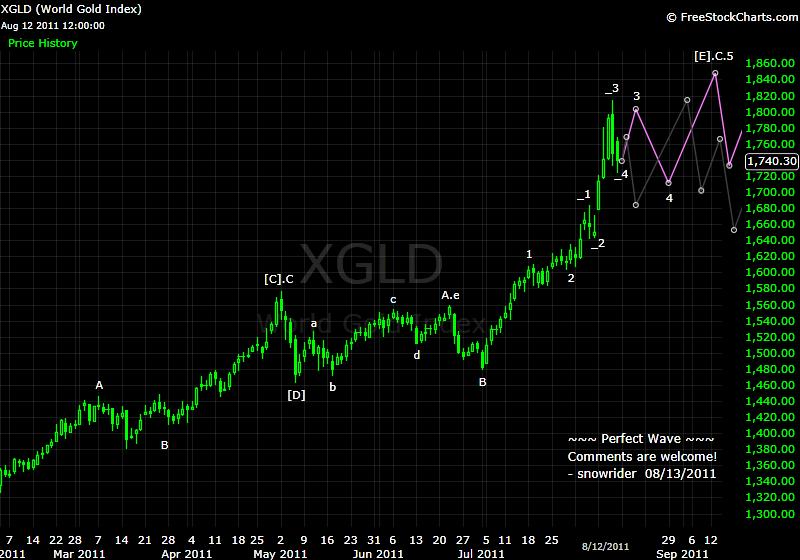
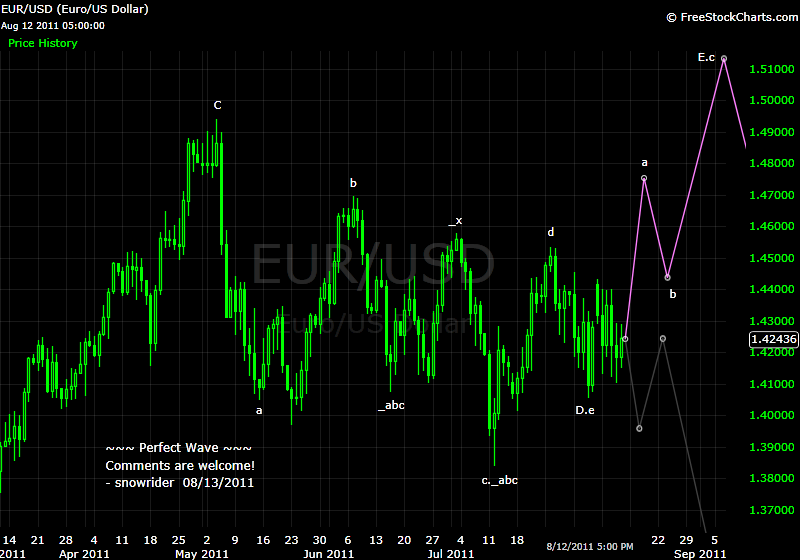
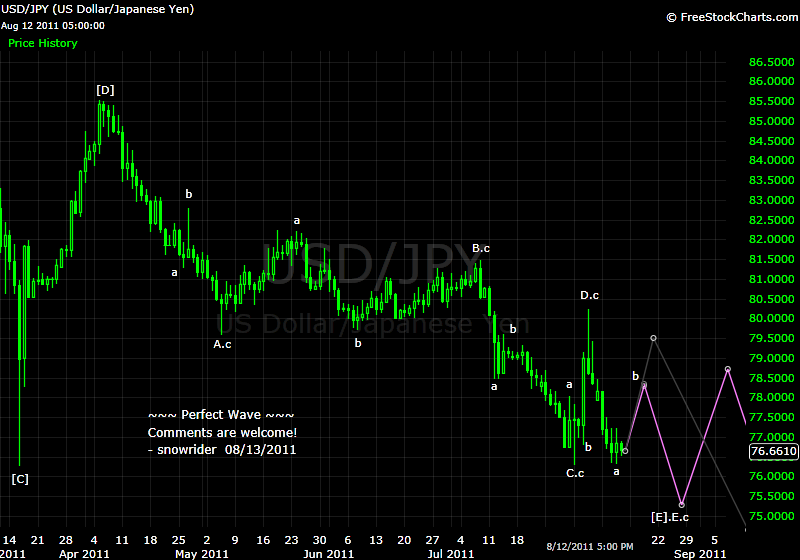
Perfect Wave - 2011-Q3
- Thread starter snowrider
- Start date
Quote from bsmith72:
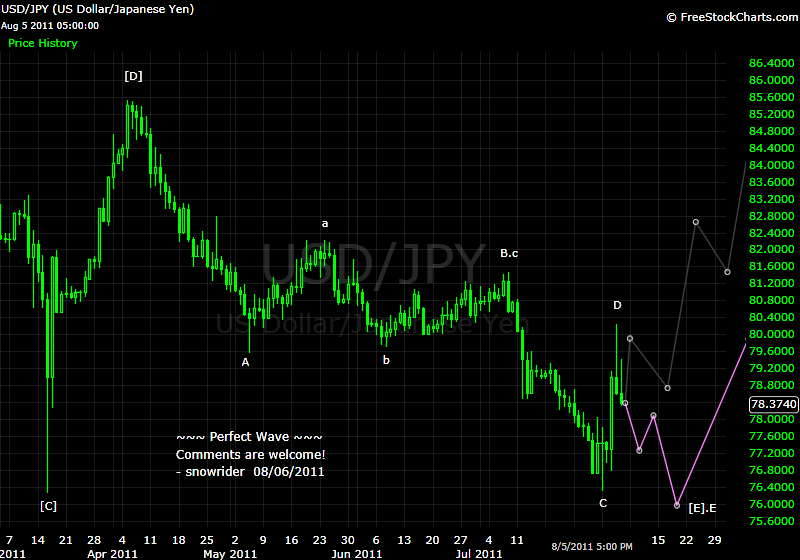
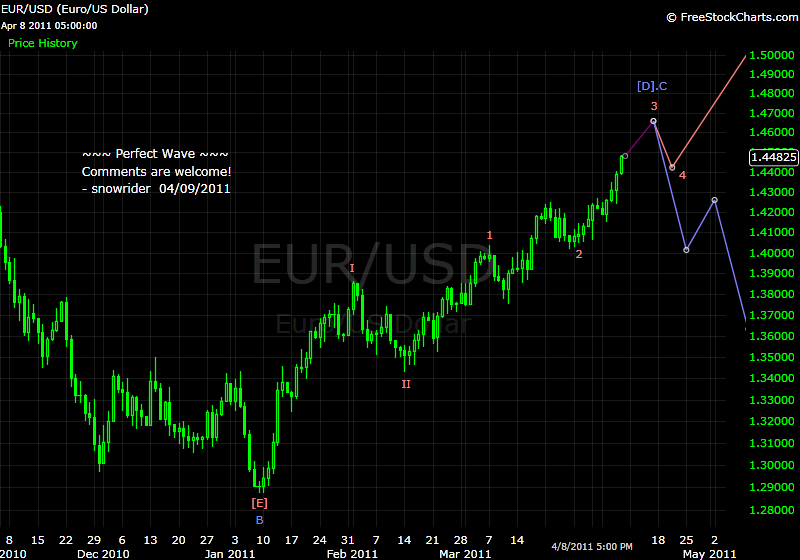
I'm following S&P 500 and EUR/USD right now.
Agree with you on the S&P 500.
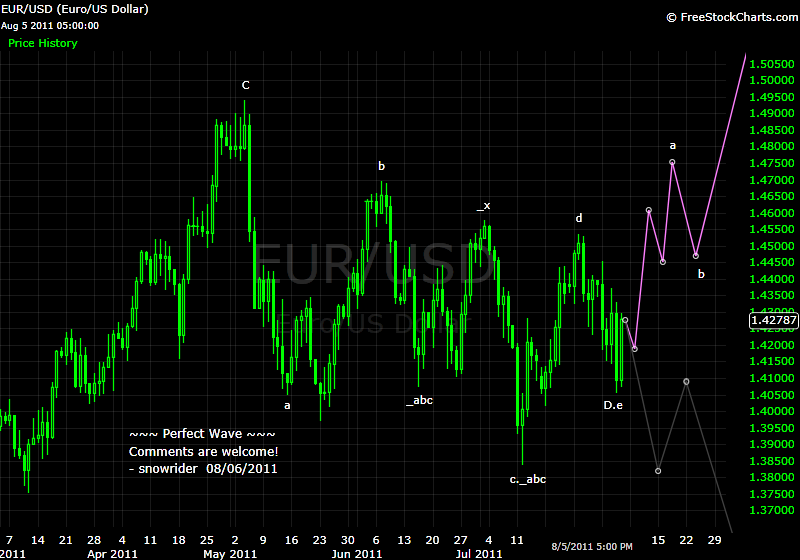
Disagree on the EUR/USD -- We both agree it's going up but I have totally different wave counts... see screenshot.
bsmith - Thanks for contributing your good wave count on EUR. I actualy once had similar count back in April.
About SP, we need to recount the wave. It seems that the c is extending.
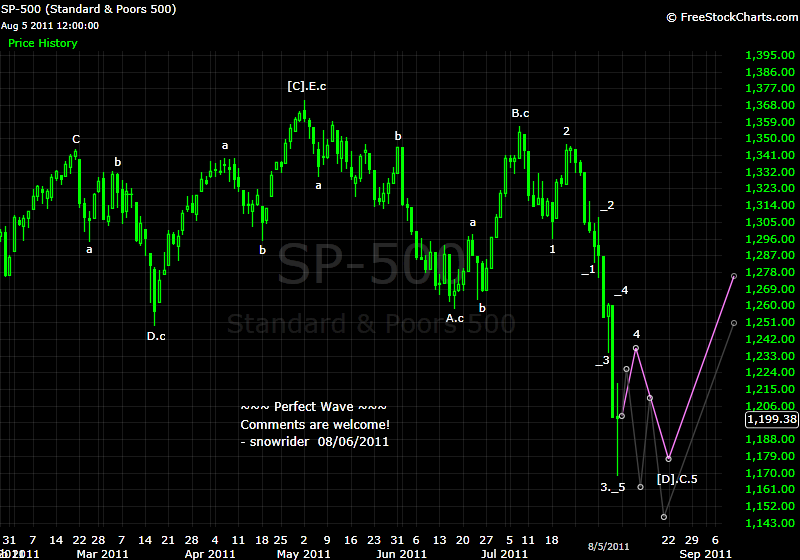
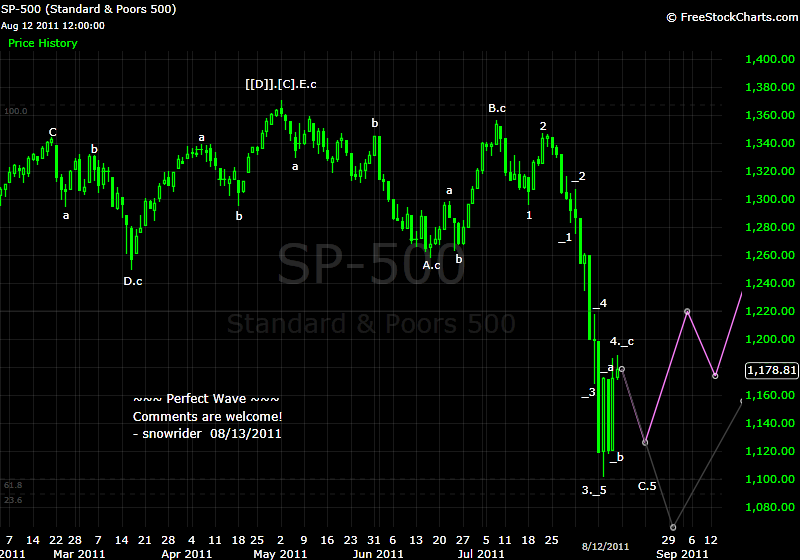
I think the overall trend is a motive wave down instead of a corrective move as you have in your chart. Have you looked at this option? Just interested to know why you think it's a correction?
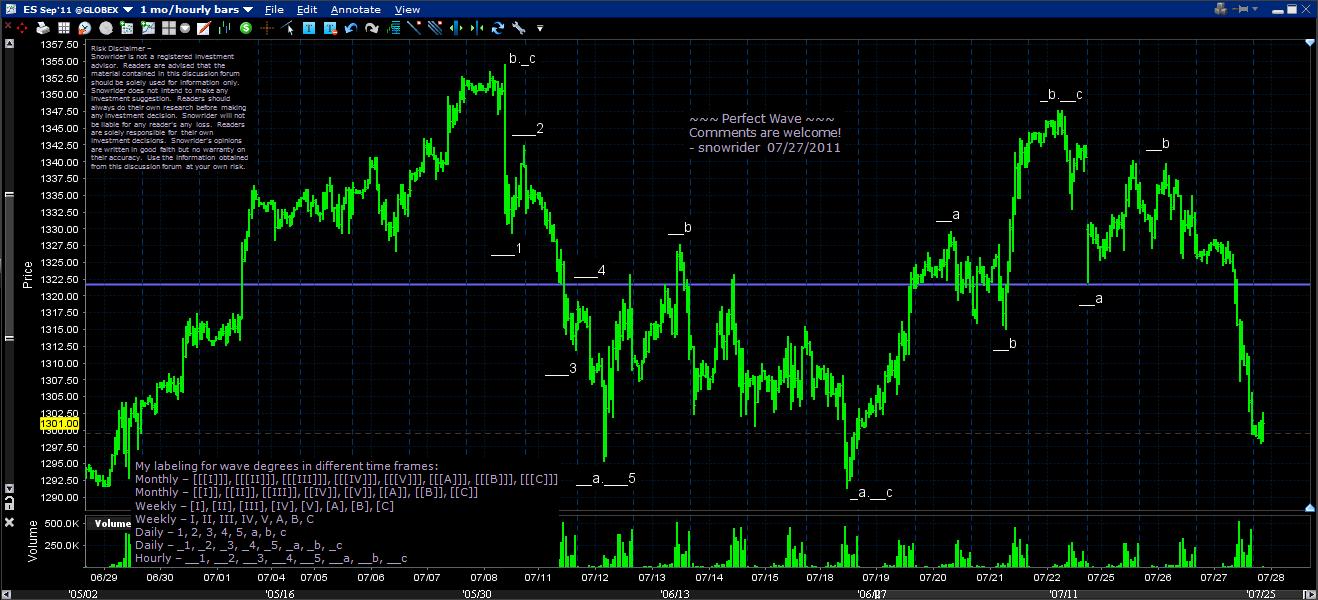
Here's my updated charts for S&P 500. I think we are in a Wave 4 pattern right now. Once this completes, we can look for a Wave 5 and draw our projections from there. (sorry about the size of the charts -- not sure how to make them smaller?)


Here's my updated charts for S&P 500. I think we are in a Wave 4 pattern right now. Once this completes, we can look for a Wave 5 and draw our projections from there. (sorry about the size of the charts -- not sure how to make them smaller?)
Quote from bsmith72:
I think the overall trend is a motive wave down instead of a corrective move as you have in your chart. Have you looked at this option? Just interested to know why you think it's a correction?
Here's my updated charts for S&P 500. I think we are in a Wave 4 pattern right now. Once this completes, we can look for a Wave 5 and draw our projections from there. (sorry about the size of the charts -- not sure how to make them smaller?)
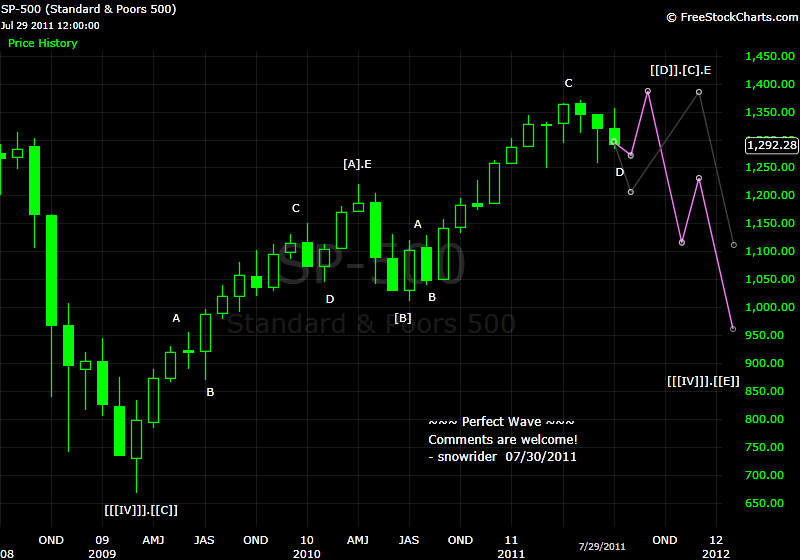
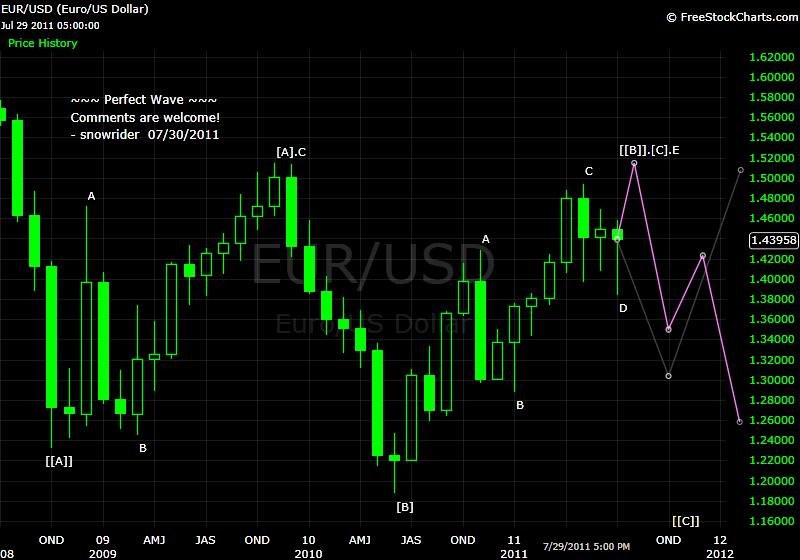
bsmith72 - I assume that you are talking about the SP? Yes, I have taken that into consideration. The following monthly chart is from an old post:
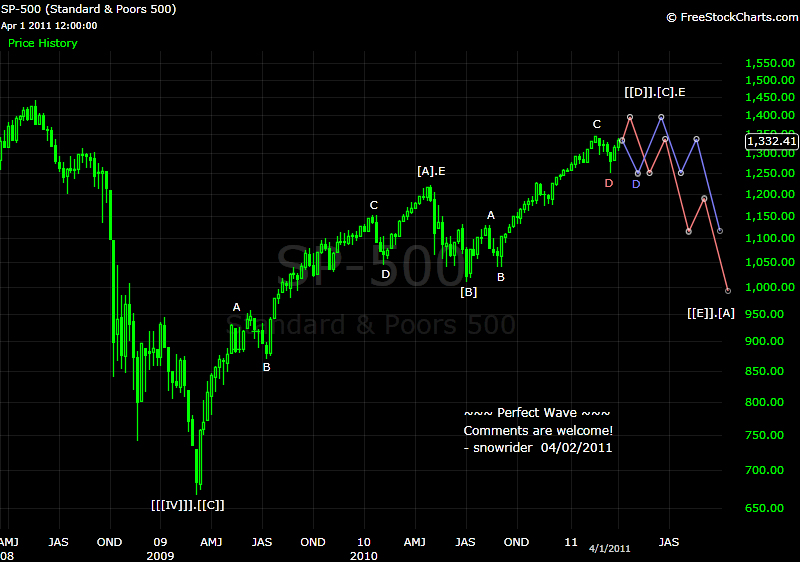
It is probably on the way to an [[E]] of [[[IV]]].
Can you post your charts again because they are showing broken links.
Quote from snowrider:
bsmith72 - I assume that you are talking about the SP? Yes, I have taken that into consideration. The following monthly chart is from an old post:
It is probably on the way to an [[E]] of [[[IV]]].
Can you post your charts again because they are showing broken links.
Sorry, I've made them attachments this time - Here's the S&P 500 30 min chart from Aug 10.
Attachments
Quote from snowrider:
bsmith72 - I assume that you are talking about the SP? Yes, I have taken that into consideration. The following monthly chart is from an old post:
It is probably on the way to an [[E]] of [[[IV]]].
Can you post your charts again because they are showing broken links.
And here's my S&P 500 4 hour chart from Aug 10.