Thanks.
Hmm, I seem to be missing a lot.
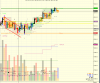
On bar 9 or so, the bar was assigned P2 on your chart. Is there a reason for that bar not being a BO,T1? 8:30 bar could also have been P2 but that one was assigned BO,T1. Is it because the first one (BM rev bar) was steep and rtl would have been too steep?
StR and StB's are internals, therefore a wait. What helps with internals is to 'squish' the wait bar into the prior bar. Doing this on this bar kept the close within the rtl established by the prior bar T1. It was also a UL, so measure volume and log the bar.
StR and StB's can be a logged as a FS, if a FS was more appropriate. Since we are in a drift type D trend, a BO,T1 here would have made this EE a C turn completing the D trend.
The indicator is actually supposed to color the OB bars but indicators can't override stepan's program for bar coloring mechanism (which I find helpful) because it seems to be embedded into the bar type lol. I ended up resorting to having it labeled on top of the bar for now.
I've actually done the 5x5 drill when I first started reading this but I don't understand the difference between sentiment and single 5 minute bar sentiment (how sentiment can be for multiple bars? vs single bar).
The day starts, a 30m bar begins. This 30m bar will eventually contain 6 5m bars. The 5m bars will form the 1,2 or 3rd legs of the 30m. This 30m bar has a sentiment, this sentiment is aligned with the 2nd leg. This sentiment can continue or change throughout the forming of the bar. The 5m bar also has a sentiment composed of 5 1m bars. The 5m also has a form, a price case associated with it. This form also has a sentiment.
It seems every EE gets a turn type which seems to build the trend set as it progresses (as Jack mentioned every trend starts from set A and B the incomplete to Set C and D the complete normal trends).
Correct, trends move forward in an irreversible manner. They can complete or be incomplete and interrupted by trend cycling in the opposite direction. The incomplete trends are defined.
Is the turn type kind of subjective? (I think tiddlywinks mentioned it but I can't seem to grasp my head around it) I initially thought if I log correctly, I would be ruling out turn types and trend sets according to the modrian table but this area is still much of a blur for me.
No, turn type is not subjective. What is critical about turn types are correctly ID'ing EE's. This is supported by having the carryover. That's why I recommend getting into the practice of the VTP and building your reference charts. Building your trading library makes debriefing easier and faster.
I wish I can pinpoint what it is that determines turn types and how to use the modrian table.
You just have to guess at first and be ok with guessing. Refer to the previous posted pattern and see the dashed line as the orthogonal max profit path of the parallelogram. Looking more closely, c turns start with a P1, however not all P1's are c turns. As one follows the path of price, one can see the relationship between the volume bands and the dependent moves of price. Notice where an a turn can begin and where it cannot, same with the b turn.
A good exercise is to create the symmetrical opposite of the above drawing. The cycle would start with the short trend failing into the start of the long.
Let's say you have identified an EE that is in the n-1 column of Set A trend. The n column has the list of the possible c turns that can come after this n-1 EE. If the EE that presents is not in this list, then that EE is the only alternative it can be, which in this case is an a turn.
Now we have an a turn EE assigned as an Set A trend.
On the next EE, one goes to the next trend which is B. The n-1 column of Set B is where you look to find the previous a turn, A trend EE.
The Modrian table has in the n column all the possible c turns from this a turn. If the turn is found this EE is a c turn completing the Set B trend. One then restarts at the beginning with Set A.
If this EE is not in the n column then it is the only other turn that it can be which is a b turn.
This EE would be a b turn which fails to complete Set B and advances the trend to Set C where one continues the process.